

Do faceoffs matter in 3-on-3 overtime?
How winning a faceoff leads to winning, or not

While everyone else focuses on the trade deadline this afternoon, I thought it’d be interesting to take a look at an old topic that I find interesting: the importance of faceoffs in 3-on-3 overtime!
Note: I originally began writing this article roughly two years ago to analyze then-Dallas Stars head coach Rick Bowness’s strategy of starting overtime with non-scoring faceoff specialists, but I abandoned it when I got busy with other stuff. Although Rick Bowness and the Stars have moved on from each other, I think this topic is still relevant as the previous 3-on-3 research I found seems to have disappeared and I haven’t found anything to replace it. I’ve left my original opening and the framing essentially as-is but updated my research to be current through the 2022-23 season.
Recently, following an overtime loss by the Dallas Stars to the Minnesota Wild, Saad Yousuf at The Athletic questioned the Stars’ strategy of starting overtime with defensive forwards who excel at faceoffs, over any of the more offensively talented forwards on the roster. Essentially, the Stars’ game plan is to win the opening faceoff to get the first chance at winning the game, and for the defensive-minded players to change as soon as possession is gained. Yousuf notes that in the previous overtime game against Toronto, which the Stars lost, the coaching staff would have considered the plan to have worked since the Stars generated a chance before Toronto got possession. Yousuf notes, however, that the Stars actually have a better record in overtime this season when losing the opening faceoff than when they win.
This led me to wonder, how correlated is winning faceoffs to winning games in overtime? Previous work done on faceoffs has shown they have very little, though not quite zero, impact on the overall outcome of the game. However, this has focused mainly on 5-on-5 impact, while Yousuf’s article was focused on a single season of a single team. Faceoffs at 3-on-3, on the other hand, are largely unexplored. In this article, I’ll look at the impact winning the first faceoff of overtime has on teams’ performance in overtime, plus the impact winning a 3-on-3 faceoff has on performance in the subsequent shift.
All data in this article is from Evolving-Hockey.com.
Methodology
For this analysis, I looked at all overtime 3-on-3 faceoffs taken since the 2015-16 season when the NHL introduced the format, a total of 4,861 faceoffs spread across 2,111 games. I started my analysis by looking at game results based on which team won the opening faceoff since that was the comment that inspired this article. Next, I looked at the impact of winning the faceoff before an overtime goal. However, both these cases are pretty straightforward and not all that interesting. From there, I decided to examine the impact of faceoffs on the various shot metrics available finding some surprising results that provide some insight into offensive creation in overtime.
Results
First, does the team that wins the opening faceoff win the game more often? The answer is yes, but just barely.

The team that wins the first faceoff has a record of 698-670, roughly a 51% winning percentage excluding games that end in a shootout. The R-squared between winning the first faceoff and winning the game is just 0.0004, meaning the first faceoff explains roughly 0.04% of who wins. So winning the first faceoff doesn’t matter, I guess. But does winning a faceoff increase the chances of scoring a goal on the following shift? Again, the answer is yes, but just barely.

Teams that score a 3-on-3 goal won the faceoff preceding a goal scored 612 times, compared to 579 times they lost the preceding faceoff. That’s a winning percentage of 51.4%! The R-squared between winning the preceding faceoff and winning the game is 0.0008, twice the value of just winning the first faceoff of overtime. However, this is still vanishingly small, bordering on completely irrelevant. But do faceoffs really not matter in overtime? That doesn’t seem to line up with the experience of watching the games when the team that wins a faceoff typically tries to hold the puck until a scoring opportunity opens up. Is it possible that looking only at the result of the game is obscuring the impact of faceoffs somehow? Or are the results of the first few seasons of 3-on-3 before coaches figured out more effective strategies skewing the overall results? Let’s dig deeper into the underlying metrics and trends to see if there’s anything to discover.
More Results - Shot Metrics and Trends
We’ll begin by asking, what is the correlation between a team’s faceoff percentage and their shot share percentage within a game?

Here we can see that faceoff percentage is positively correlated with all underlying shot metrics at a statistically significant level. The correlation grows weaker as the metrics get more specific, however (faceoff percentage and goals percentage are essentially uncorrelated, as we examined previously). Still, the strongest relationship (corsi) only has an R-squared of 0.0224, explaining just a little over 2% of the variation in corsi for percentage.

If we look at season-by-season trends, there does appear to be a trend of the relationship getting stronger, although this has reversed in the last two seasons. Again, the goals trend is weaker than any of the underlying metrics. This is a noteworthy development, in my opinion. It indicates that shifting tactics have impacted the importance of winning faceoffs in overtime. Next, let’s look a little more closely at things on a shift-by-shift basis, starting with whether the team that won the faceoff got the first shot attempt after the faceoff.

It turns out that winning a faceoff strongly increases a team’s chances of getting the first shot attempt. In this sense Rick Bowness was onto something, winning the faceoff does increase the likelihood of getting the first shot. The R-squared between winning a faceoff and getting the first corsi attempt is 0.071, which is very good for anything faceoff-related. Moreover, this has trended up over time with faceoff wins leading to an even greater share of first shot attempts and even goals (though that trend is less clear).
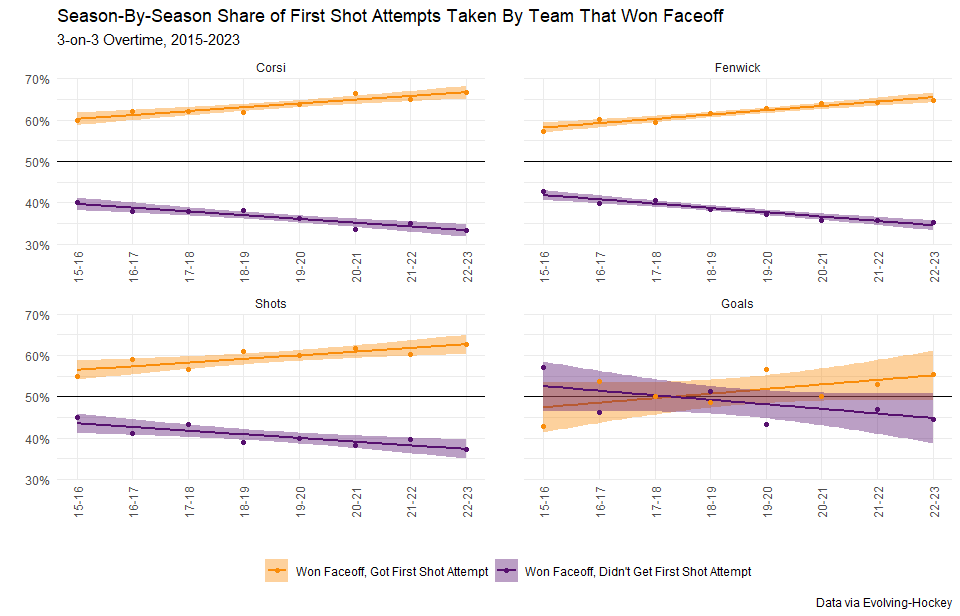
Again, I suspect this is a result of changing overtime tactics with a much greater emphasis on holding onto the puck until a chance opens up and exiting/re-entering the offensive zone if an opportunity doesn’t present itself, rather than forcing shots. (Side note: it’s probably not surprising that blocked shot percentage is much lower at 3-on-3 than 5-on-5).
Finally, I’d like to wrap this section up with a look at overall shot share for the entire shift following a faceoff win, not just which team got the first shot.

Once again, we see a clear advantage in the underlying shot metrics that come from getting a faceoff win, though the goals percentage lags the underlying metrics (as we looked at previously). For corsi, the strongest relationship, the R-squared is 0.039, which is a reasonably strong result for faceoffs. Looking at season-to-season trends, we can see that the same pattern we’ve observed previously holds here, with faceoffs appearing to become more impactful over time.

Two things are notable here though. First, however, corsi’s upward trend seems to be driven entirely by 2015-16 being far below the rest of the season and 2022-23 being far above the other seasons. Otherwise, the trend is downward. Second, the goals trend looks similarly driven by an outlier: in this case, the 2015-16 season being far below a 50% goal share following a faceoff win.
Analysis
So what does all this mean? First, winning a faceoff does impact shot share metrics for the following shift, particularly on which team gets the first shot attempt of that shift. In that sense, Rick Bowness and his staff were onto something with the importance of getting the first shot. Moreover, on shifts where a goal is scored, the R-squared between getting the first corsi event of a shift and getting a goal is 0.132, which is reasonably high for anything in hockey. However, the relationship between winning a faceoff and getting a goal on the subsequent shift is almost zero. How can we explain this? I think this is a case of conditional probabilities whittling the overall probably down to a miniscule size. The odds of winning the first faceoff, converting that faceoff into a corsi attempt, and then converting that corsi attempt into a goal grow progressively smaller to the point that the advantage of holding possession at the beginning of the shift essentially disappears.
Second, overtime tactical changes have clearly had an impact on the game. The impact of faceoff wins on underlying shot metrics has gotten stronger almost every season like clockwork. Teams prefer to avoid turnovers and wait for open chances once they have possession now than when 3-on-3 overtime was first adopted. However, this has only slightly impacted the relationship between faceoffs and scoring goals, which brings me to my final takeaway.
The most dangerous chances at 3-on-3 don’t come off of faceoffs. This is my best explanation for why winning the faceoff translates into a possession/shot metric advantage, but not a winning advantage. Coming off a faceoff loss, the team without the puck will retreat into a defensive structure, making it difficult for the offensive team to break through with a true high-quality chance. On the other hand, after a failed offensive chance, the defending team can quickly transition to offense and spring an odd man rush or a breakaway in the other direction. You don’t have to be an expected goals truther to recognize that a 2-on-1 rush has a far greater chance of creating a goal than a 3-on-3 entry. Transition play is just much more impactful than faceoff ability.
Conclusion
Contrary to what I expected, Rick Bowness may have been right about the relationship between winning a faceoff and getting the first scoring chance. Furthermore, that relationship has gotten stronger in recent seasons. However, given the conversion rate on scoring chances, and the relatively higher danger of counterattack chances, the relationship between winning 3-on-3 faceoffs and winning games is virtually non-existent. Coaches would be better served by putting out strong retrieval and transition players to start overtime instead of limited faceoff specialists.