At the beginning of last season, the NHL announced NHL EDGE, its first new data since the Real-Time Scoring System (RTSS) was introduced for the 2007-08 season. At the time, I took a look at the team-level data, first distributions and year-to-year repeatability, then the correlation between burst rates and shot rates for/against. I found that generally most metrics were repeatable year-to-year at the team level. Furthermore, burst rates were correlated more strongly with offense than defense.
Returning to this topic for the offseason, I want approach things from a player level, rather than a team level. Starting with skating speed, I plan to have a series of articles examining how each of the metrics provided by the NHL EDGE portal relate to the currently available public metrics (corsi, expected goals, wins above replacement, etc.) to see whether there is any additional value that can be gained by incorporating them.
This post will begin with an overview of how max speed, speed bursts rates, and average speed are distributed leaguewide by position. Part 2 will look into how fatigue and role may affect the topline numbers and part 3 will wrap up with a look at how speed does or does not impact offensive and defensive rates.
Limitations
Before I begin, I want to provide a quick reminder of the limitations of the data provided by the NHL EDGE portal. Except for skating distance, which has includes game-by-game values, all stats are aggregated at the season-level. Furthermore, maximum skating speed, speed bursts, and shot speed are aggregated for all-situations totals. Only skating distance and zone time are broken out by different strengths (even strength, power play, and penalty kill).
Max Skating Speed
18 MPH seems to be the cutoff the NHL uses when assessing top speed. A small number of players (5) with very limited playing time failed to reach this threshold and are excluded from all analysis around max skating speed.
Not surprisingly, forwards tend to be faster than defensemen. The median forward tops out at slightly more than 22 MPH, while the median defenseman is slightly below 22 MPH. Looking at the middle eightieth percentiles, forwards’ top speed typically fell between 21 and 23 MPH, while defensemen were roughly between 20.2 and 22.8 MPH. Finally, the fastest forward (Denis Gurianov in 2021-22) topped out at 24.6 MPH, while the fastest defenseman (Martin Fehervary in 2022-23) “only” reached 24.21 MPH.
Two things about the distribution are notable to me. First, is that both forwards and defensemen exhibit a left-skew, though it is more pronounced for forwards. Second, and more interesting to me is that the range of top speeds is roughly the same for each position. In fact, the total skaters for each position with a top speed below 20 MPH is almost identical, despite there being far fewer defensemen seasons. I suspect this is due to roles in the modern NHL where skating speed is more valued in depth/energy players, while depth defensemen are more typically special teams specialists. This is something I will take a closer look at in part 2 of this series.
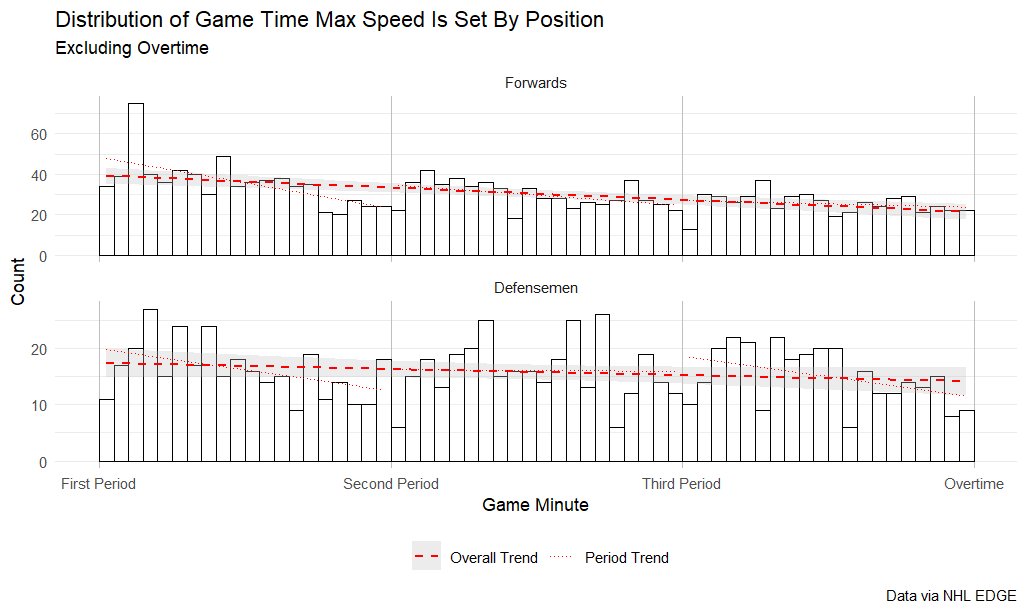
NHL EDGE also helpfully includes when exactly a player set a max speed. Looking at the distribution when players skated their fastest, there is a clear difference between forwards and defensemen. Overtime is excluded from the below chart because not all games go to overtime, meaning there are fewer opportunities to set a top speed in the extra frame.
Forwards display if pretty clear trend of setting top speeds earlier in the game, while defensemen are roughly flat throughout the game (the slope is not statistically significant at 90% confidence). By period, each period also features the same downward trend, though the first minute is not a common time to set a top speed. This mirrors a similar pattern of shot rates in the first minute of a period being noticeably lower than the rest of the period. Also of interest, defensemen do not exhibit a downward trend for the second period, when they have to deal with a long change.
So does this mean defensemen have better conditioning? I don’t think so. Rather, I think this is a case of defensemen conserving their energy because they know the distance to the bench may make it more difficult to make a change.
For completeness, here is the same chart with overtime included.
It is interesting to see so many defensemen set a max speed in the first minute of over time, despite far fewer games making it to the extra period.
Burst Rates
For burst rates, I used a 20 game cutoff to avoid players with limited playing time throwing off the distribution. 20 games is a bit arbitrary, but this cutoff limited the dataset to roughly 710 skaters per season, which works out to about 22 per team, so I think it works as a reasonable cutoff for the skaters who fill up a 23 man roster, plus the first call-up from the AHL. The NHL used 18 MPH as the lowest threshold for a “burst,” so first I examined the distribution of all bursts 18 MPH or greater.
Obviously what stands out the most here is forwards “burst” much, much more than defensemen: the 10th percentile forward has a higher rate of bursts than the 90th percentile defensemen. By percentile, forwards burst and roughly twice the rate defensemen do.
Also notable notable in this distribution is a slight right-skew, compared to the left-skew displayed in the distribution of max speeds. I’m not sure how to interpret this, except that this is the difference between speed and acceleration and NHL teams seem able to identify fast skaters, but not necessarily quick accelerators.
Since 18 MPH is a threshold all NHL players are capable of, I also looked at 20+ MPH burst rates.
Here the skew is even more pronounced, though though the difference positions is actually slightly smaller than at the lower cutoff. It’s safe to say though that getting up to 20+ MPH regularly is difficult though.
As mentioned in the max speed section, I suspect role or expected ice time plays a role in how often a player chooses to exert themselves, though top speed ability also likely plays role. The top of the 18+ MPH burst leaderboard is dominated by depth players, while the 20+ MPH cutoff is features top line players like Nathan MacKinnon (three of the top six and top overall rate for his 2023-24 season), Connor McDavid, Roope Hintz, and Brayden Point. I interpret that as these players conserving their energy until they need it, while depth players are expected to “work” harder. I also wonder if this is due to these player being relied on for power play entries, but I don’t have a clever way of deducing that from the available data.
Average Speed
Like burst rates, I’m using a 20 game cutoff for average speed to help avoid small individual samples from skewing the distribution. I prefer average skated speed to distance skated, because it accounts for ice time and I think it’s more intuitive to interpret than distance. For this section, I looked at even strength, rather than all situations like I did for max speed and bursts. I chose to limit this analysis to even strength because special teams tend to be played at a slower pace and this provides a more accurate view of the league distribution, in my opinion.
This is the most even distribution so far. Interestingly the ranges are roughly the same by position, but the for defensemen it’s shifted a bit more than a 1 MPH slower than forwards. This makes sense given what we’ve seen so far from other speed metrics. I don’t think average speed is particularly interesting in and of itself, but the fact that it is the only metric the NHL released game-by-game data for means I’ll be focusing more on average speed in subsequent posts.
Correlations
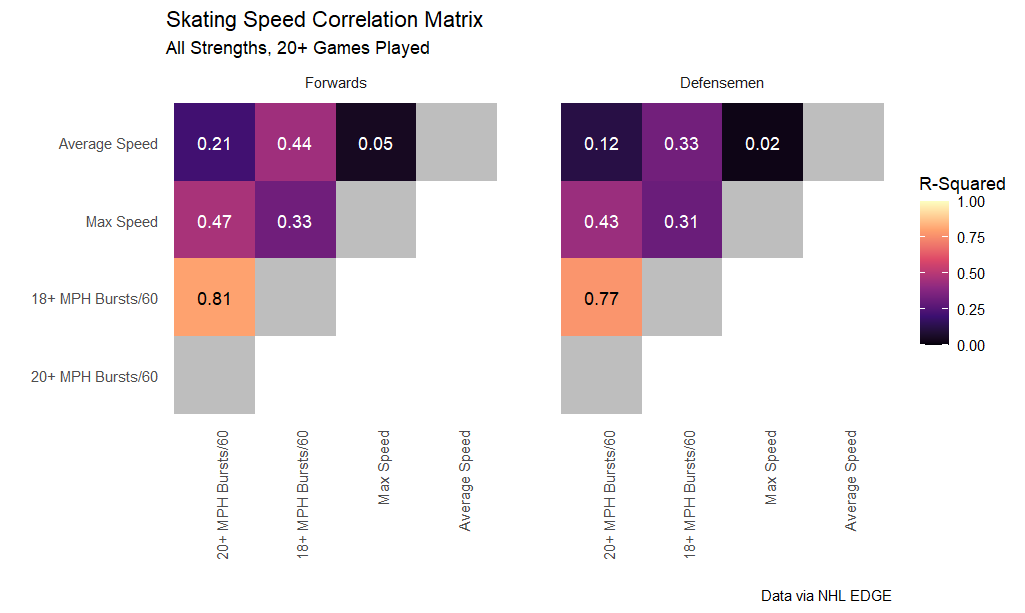
Finally, I’ll wrap up by checking how correlated the various skating speed metrics are to each other. For this analysis, I used all situations for averages speed, to keep the comparison apples-to-apples, and I limited the sample to players with 20 games or more played in a season to avoid outliers skewing the data.
All of the metrics had positive correlations with each other, which is not surprising. The correlation between average speed and max speed was the weakest by far, though all correlations were statistically significant at a 99% confidence level. Across the board the correlation between metrics was weaker for defensemen than forwards.
The most notable finding, to me, is that max speed has a stronger correlation with 20+ MPH burst rate than 18+ MPH burst rate, while for average speed this is reversed. This supports my earlier theory that there is some interplay between role and ability.
Conclusion
It’s apparent that skating speed is more valued in forwards than defensemen. However teams seem to value top speed and “hustle” over acceleration. There seems to be some evidence that skating speed is role dependent, both in what is expected from a player in a role and in how players conserve their energy based on that, which I’ll look at next time.


