NHL EDGE: Stanley Cup Final Recap
A game-by-game look at skating speed, shot speed, and zone time
During the Stanley Cup Final this June, I had the idea of re-scraping the NHL EDGE pages for every player after each game they played and comparing the changes in their totals to get game-by-game data for the EDGE stats that don’t have those breakdown (skating speed, shot speed, and zone time). Unfortunately, this didn’t cross my mind until the Conference Finals ended, meaning I only captured game logs for the Final. Seven games between just two teams is not really enough of a sample size to draw strong conclusions about what this data means, so this post is more trivia than analysis. Still, there is enough in the data to speculate irresponsibly about what it might mean.
So without further ado, with a new NHL season starting (in North America) today, there’s no better time to look back at the last seven games of the previous season.
Skating Speed
Skating bursts are by far the most interesting stat captured by the NHL EDGE sensors, in my opinion. As a viewer, the most exciting plays to watch tend to be when rushes, breakaways, or occasionally an exciting backcheck. Anecdotally, at least, players skating fast mean things are happening.
Despite Edmonton having more skaters with top end speed, Florida was able to match the Oilers through the first two games and in the final two games. The teams were roughly equal in 18-20 MPH bursts throughout the series, but Edmonton’s top-end skaters managed to make a difference in games three through five. Interestingly, these were among the games Edmonton did the best in (though they lost game three). I suspect that speed bursts are more predictive of offense than overall speed, though they are closely related.
Also notable is the downward trend in overall bursts until a tick up in game seven, though this is is limited to forwards. Game four in particular was quite sluggish with Florida’s forwards putting up their worst effort. Edmonton unfortunately saved their worst performance for game seven, driven mostly by a drop-off from their high-end skaters.
Speaking of those high-end skaters, let’s look a little closer at who those skaters are. Not surprisingly, Connor McDavid has the most bursts of 18+ MPH. However, I was blown away by Ryan McLeod’s burst numbers. In the chart below, McLeod’s burst rate is highlighted by the diagonal line.
McLeod outpaces everyone on a per minute basis, even McDavid (top right corner of the forwards chart). As I’ve discovered previously, however, 18+ MPH bursts are strongly correlated with role, especially for forwards. Although, McLeod is certainly a fast skater, how much of his ridiculous speed is due to being a depth forward?
If we look only at 20+ MPH bursts, however, the charts look pretty much the same.
Even at the higher cutoff, Ryan McLeod sets the pace, though McDavid and Connor Brown are not far behind him. As we can see here, Edmonton’s speed superiority was mostly driven by these three players. Below them, the points are a fairly even mix of red and blue dots.
Shot Speed
I haven’t looked at shot speed before, mainly because the data is not as useful at a season level, though I have some ideas to explore around potential impacts on accuracy and finishing.
Edmonton’s defensemen shot the puck much harder than Florida’s, though interestingly not in games five and six, which they won. I have a suspicion that lots of shots by defensemen are generally a negative predictor for which team wins, since defensemen are not typically chosen for their position based on their offensive ability.
In a reverse of the trend for skating speed, the number of high speed shot attempts by forwards per game generally increased throughout the series, and I am at a lost as to why that might be. Before looking at this, I would have suspected that high speed shots were a function of power play time, but as we’ll see later, power plays trended down throughout the series.
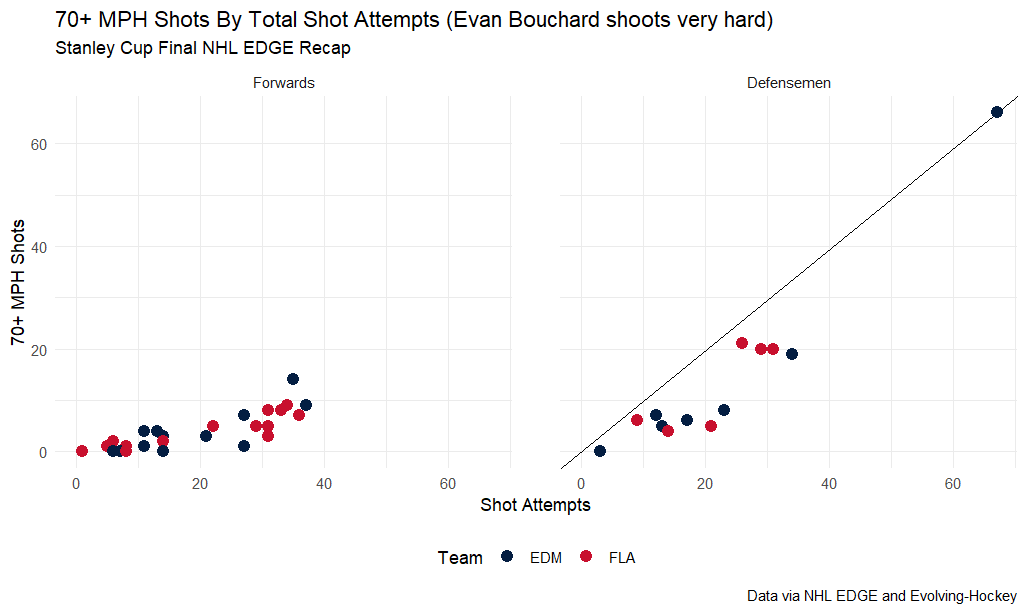
The data for defensemen is much noisier, but there’s a simple reason for that: One player was responsible for a huge number of the shots above 70 MPH: Evan Bouchard.
This chart shows just how ridiculous Bouchard’s shot is. Only three other players, all defensemen, had even 20 shots above 70 MPH, with Oliver Ekman-Larsson topping out at 21 such shots. Bouchard had more than three times that many, with 66 shots breaking 70.
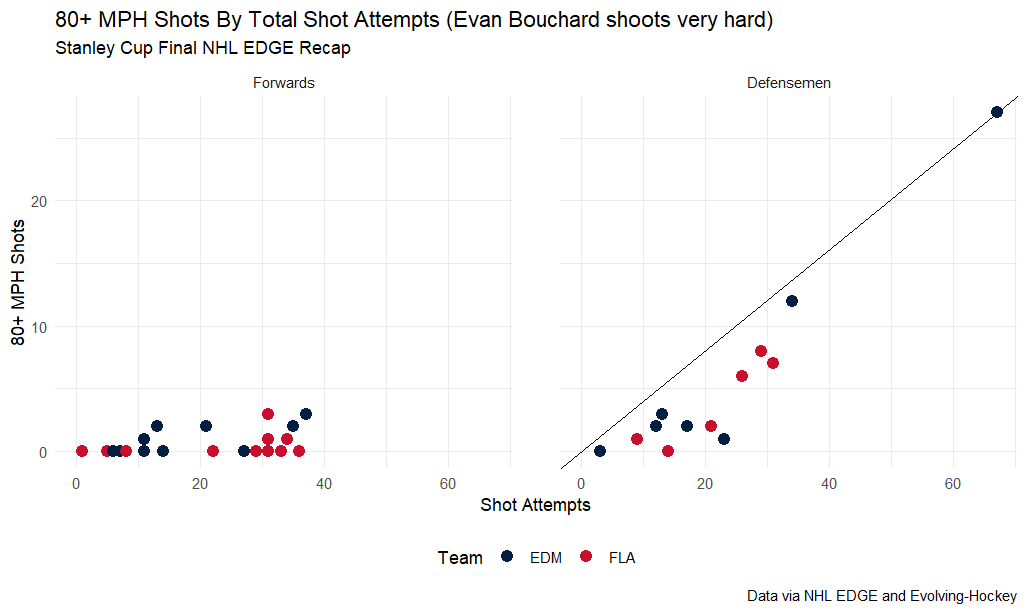
Raising the cutoff to 80 MPH yields a similar chart, but also shows just how rare it is for forwards to take shot above even 80 MPH. Only a handful break that threshold, and none did so more than three times in seven games.
Just for completeness, only three players recorded shots at the 90+ MPH level: Bouchard, Gustav Forsling, and Brandon Montour. Montour had one, Forsling had four, and Bouchard had sixteen.
Zone Time
Even Strength
With just seven games, even strength zone time doesn’t reveal much, except that Florida tended to spend more time in the offensive zone than Edmonton did, though the difference between the two teams were mostly pretty small.
I thought perhaps there would be a greater difference between forwards and defensemen, particularly when a team may be defending a lead and having their defensemen sit back, but this is not apparent in the data. Instead, it seems like either the full five man unit tries to gain the offensive zone or the whole unit hangs back.
With the exceptions of games two and seven, the team with more offensive zone time tended to lose the game. This suggests that zone time is subject to score effects as teams that are trailing tend to push more to enter the zone, while teams that are leading sit back more.
Special Teams
Special teams are definitely worth a closer look once I have more individual game data. I hope that more data reveals potential stylistic differences and how styles match up against each other. As it stands, I think the Final does uncover some meaningful differences in how Edmonton and Florida approached special teams.
In general Edmonton’s penalty kill was more aggressive than Florida’s, as measured by how much time the PK unit spent in the offensive zone. This shows up in the reverse as well, as Florida’s power play unit had difficulty getting into the offensive zone and staying there.
Game two in particular was a disaster for Florida’s power play, though they did manage to score their only power play goal of the series. Despite having two more minutes on the man advantage, they spent less time in the offensive zone than the Oilers’ unit. In fact, Edmonton’s penalty kill had nearly as much offensive time as the Florida’s power play. Somewhat contradictorily, however, the two games Edmonton scored shorthanded goals (games four and five) were the games with the least offensive zone time shorthanded. Of course in such a small sample conversion rate is largely luck, so there may not be anything meaningful to this trend.
By contrast, Edmonton’s best power play games from a conversion standpoint (games four and five) came with two of their three smallest percentages of time spent in the offensive zone. I interpret this to potentially mean rush chances convert at a better rate than in-zone chances. I believe this theory has some support from the data tracked by Corey Sznajder as part of his All Three Zones project. If this is meaningful, it would be interesting to see a power play organized around attempting to create rush chances rather than trying to gain the zone and set up the same 1-3-1 almost every team uses now.
Game seven also stands out for how the Oilers spent almost the entirety of their only power play in the offensive zone. This is worth a look from another angle: average skating speed.
It’s clear looking at Edmonton’s power play in game seven that more time spent in the offensive zone is negatively correlated with skating speed. From this, it seems like Edmonton’s average in-zone skating speed was roughly 6 MPH, with higher speeds being due to regrouping and re-entering the zone. Florida consistently skated more, but this seems caused by how effective Edmonton’s penalty kill was at denying them time in the offensive zone. This makes it difficult to determine how much in-zone movement Florida had in contrast to Edmonton. Finally, the speed gap between Florida’s PK and Edmonton’s PP is noticeably smaller than the gap between Edmonton’s PK and Florida’s PP. This did not result in Florida being a more effective penalty killing team, however, as Edmonton outpaced them in terms of expected goals per hour 8.9 to 7.4 for the series.
In all, special teams appear to be the area of the game where tracking data can potentially make the largest impact in terms of tactical approach.
Conclusion
Although seven games is not enough to proclaim anything with any certainty, it is enough that some trends start to appear. Teams that burst more tend to win. Teams with more hard shots, or shots by defensemen, tend to lose. Aggressive penalty killing seems to be more effective, while generating rush chances on the power play may be more a more effective way of converting than in-zone play. Whether those trends are signal or noise will hopefully be answered this season with a more robust data set.


I knew this was going to be a good idea back when you suggested it.
I would love if you were correct and power plays with more rush involved are systematically more successful, because as it stands right now, power plays (as a neutral observer, which being a fan of the Leafs and Islanders I am most of the time once April rolls around) are the most boring part of the game. Without any interest in a particular team's increased odds to score, all I see is a bunch of hockey players, just kind of standing there. I've (anecdotally) found that when a power play happens is when games begin to lose my attention. Power plays involving more rushes don't fall victim to this as much, so I sincerely hope that's a real trend.
Also, LOL at a game seven having only six minutes of combined penalties. Are these the most disciplined teams on Earth, or is the NHL horrendous at officiating?
I know what you said in the piece, but I'd like you to expand a bit. Do you think a hard shooting defenceman is a useless skill? Obviously, shooting harder in a vacuum is better than shooting less hard, but you made it seem like an equivalent to being able to throw the ball 80 yards at the NFL scouting combine instead of just 70, which is met with a 'who cares' by literally everybody. Is that the same here, or is there any universe where it can actually be a skill worth paying for?
If you plan to do this for the impending NHL season, I'll be anxiously awaiting results. I still think this is a great idea!