

Size and Age in the NHL, Pt. 1
Which teams are actually the oldest? Biggest?

Size is a funny thing. To me anyway. Reading through xkcd’s “What If?” series, I was struck by how often the answer came down to how big (or small) an object was. Size is a thing in the NHL too, with teams clearly placing an emphasis on size. A Google search for “you can’t teach size nhl” currently returns over 4 million results and it’s not uncommon to see some variation of “skates well for a big guy” or “good hands for a big player” when talking about large but otherwise under skilled prospects. Whether it matters or not, teams care about size.
Every year, James Mirtle runs a post called “Sizing Up The NHL” at The Athletic. In it, he takes the average age, height, weight, draft position, and in later years the nationality of all the players who play in the early season. Mirtle gets his numbers by taking a simple average of the metrics he’s looking at. This is just a fun exercise, but I think it’s slightly more useful to look at an average weighted by ice time. It doesn’t make sense to treat Zdeno Chara’s 1672 minutes in 2017-18 the same as Nathan Gerbe’s 17 minutes. Mirtle uses a TOI cutoff, but the point still stands, I think. I doubt this changes much in the final numbers, but it should give a little insight into how coaches use their players. I’d also like to look at BMI gives a more holistic picture of size than either height or weight individually. I also excluded goalies from my analysis for two reasons, while Mirtle includes them. One, goalie size doesn’t seem like it would impact the game the same way skater side would in terms of team level results, which I plan to look at later, and two, since goalies play 60 minutes a game, including goalies would skew the numbers even further beyond their impact on the game. That will lead to slightly different numbers as well, but not dramatically different.
Player-level data was based on the standard skater table from Evolving-Hockey who are the gold standard, in my opinion, when it comes to data integrity for the NHL (more on them below and maybe in a separate post as well). Biological data was scraped from the NHL API using the API ID included in the Evolving-Hockey data. Team-level data was collected from the standings and standard tables on Evolving-Hockey. All the data is processed in R and there’s a link to my Github repository at the bottom.
Let’s Start With Age.
Age
Mirtle just takes the player’s age at the time of his article. This has led to some inconsistencies in how the age section is calculated, which he acknowledges in the 2020-21 article. I calculate age based on the same date every year, September 15, which was chosen because that is the date for draft eligibility. Partly because it makes it easier to account for leap years and mainly for giggles I calculate age in Days On Earth. Below is a bar chart for the 2020-21 season.
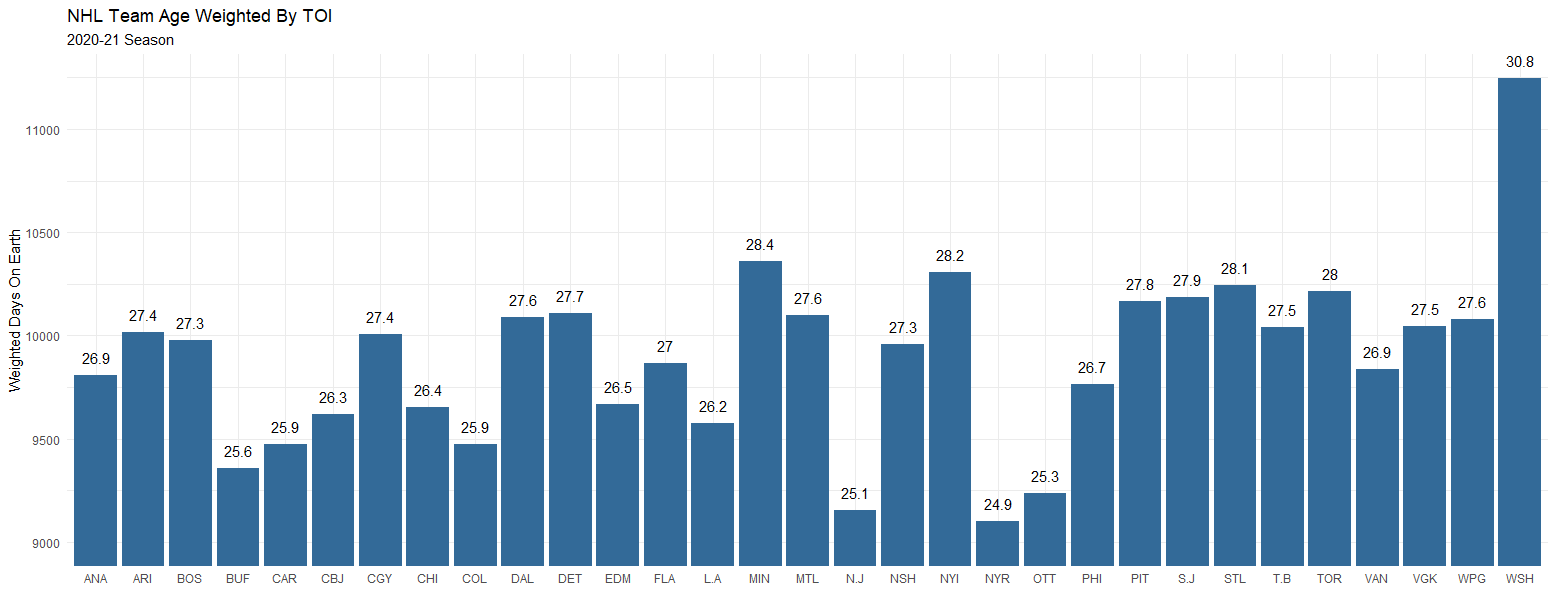
Team age in years is also placed above to make comparisons with Mirtle’s numbers easier. A few things stand out at the edges. Despite the players in Mirtle’s 2020-21 season starting in January and every player, therefore, being roughly four months older than my calculation, the New York Rangers are more than six months younger when weighted by ice time. The Washington Capitals, already significantly older than the rest of the league, are more than a full year older when weighted by ice time. The other noteworthy change is the Ottawa Senators embracing the youth movement and finishing as one of the youngest teams when weighted by ice time, despite being only eleventh oldest in the unweighted version.
Height, Weight and BMI
A note about the data before I begin, for some reason the NHL does not keep historical height and weight data for players and I haven’t been able to find a good source anywhere else. Apparently players don’t gain or lose any weight and even 18 year old rookies never grow an inch after joining the league.

NHL team heights actually exist in a fairly narrow range. The difference between the tallest and shortest team last season was a little less than two inches. Moreover, as we’ll see later, the year-to-year difference is pretty negligible. As with age, there is some movement in the overall rankings between this analysis and Mirtle’s, but this time there is not much difference between the extremes. The NHL is mostly 6’0”-6’2”.

Weight however is much more varied. The Capitals and the Blackhawks were almost twenty pounds apart last season. Not only that, but there are four teams under 195 pounds and six above 203, so over 25% of the league is more than 5 pounds from the median. The Capitals also jump almost 5 pounds (probably due to , while the Blackhawks lose about a pound when weighted by ice time.

Lastly, let’s take a look at BMI. The distribution is fairly wide with the difference between the densest and least dense teams being almost 2 BMIs. It’s interesting to see that although Tampa Bay has a bit of a reputation for being small and skilled they grade out as the top team by BMI. Although they were slightly below the median for height, they were the second heaviest team. I wonder if this is an intentional team building strategy for the Lightning or just coincidence.
Draft Position
My methodology for draft position also seems to differ from Mirtle’s a bit. Mirtle appears to exclude undrafted players from his analysis, while I decided to give the a draft position of 218 overall, or the first pick after Mr. Irrelevant.

Edmonton comes in at the highest pedigreed team in the league, not a surprise given how many top 10 picks they’ve accumulated over the last decade. Other (accidental and intentional) tank teams such as Buffalo and the New York Rangers appear in the bottom five as well. Arizona’s position is partly a reflection of their failure to convert top draft picks into top players. At the other end of the spectrum, Tampa Bay and Vegas stand out for their success despite lack of pedigree. Tampa Bay has a reputation for finding impact players in later rounds and among undrafted free agents and Vegas acquired many of their players through the expansion draft in which teams may have been more willing to expose their later round and undrafted players, such as Jonathan Marchessault. Vegas also acquired Mark Stone via trade who led their forwards in ice time last season. Florida stands out as well and this is a product of their defensive core being made up of players picked well after the first round with the exception of Aaron Ekblad.
Nationality
There isn’t much to say about nationality. Canadian’s make up over 40% of the league, with the USA taking second place with nearly 30% and the rest of the league and Sweden, Finland, Russia, the Czech Republic following and the rest of the league following well behind.

The only thing that might be worth mentioning here is that Canadian players make up a smaller percentage when weighted by ice time while the US players make up more. This seems to indicated that Canadian players make up a higher percentage of low minute players while the US players make up a higher percentage of high minute players.
Trends
So how has the league been trending?

Well, across the board the league seems to be getting younger, shorter, lighter, less dense, and drafted earlier. Also less Canadian, more American and slightly more Swedish. What to make of this?
Well, the salary cap seems to be responsible for some of this shift. Teams have realized that younger players tend to provide better value than older players, particularly young players on entry-level contracts. The shift in draft position seems to be driven by a couple of things. The first seems to be the shift in team-building strategy towards tanking and icing young teams in an attempt to maximize value through entry-level contracts. The second, though this would require more investigation, could be that teams have gotten better at drafting, so there is less value to be found in later rounds and undrafted free agency.
Height appears to have been trending down as well, but a look at the y-axis reveals that the range between the tallest season and shortest is only about a tenth of an inch, so in actuality height has stayed pretty constant. Weight on the other hand has been trending down for basically the entirety of the salary cap era. This seems partially due to the decline in enforcers, but could go beyond that to officiating changes making it easier for smaller players to survive in the NHL. BMI, of course, has also been trending down since height has been roughly constant and weight has trended down.
Finally, regarding nationality, it seems possible that the trends towards fewer Canadian players and more American and European players could be the result of better scouting identifying more players abroad who can fill depth roles better. This also would be something to investigate in the future.
Conclusions and Next Steps
So, the big question in all of this is does it matter? In my next post I’ll look at each of these facets except nationality, which may deserve a closer look later on its own, to see which traits, if any are associated with team success. I may also revisit age and draft position to try to granularize them better. For age, team age for each game can be calculated using play-by-play level data to get the exact Days on Earth for each player on the day the game was played rather than using a single cutoff date for each season. This would account for roster changes due to trades or injury throughout the year, though I don’t expect it to dramatically alter the results. For draft position, it may make a significant difference in the early cap years to alter undrafted player position to reflect the last possible pick in their final year of eligibility instead of assigning 218 to every player. This could have a significant effect for the earlier seasons as the draft was more rounds before 2005-06, so undrafted players would be positioned even later in the draft.
Fin.
A huge thank you goes to Evolving-Hockey for providing team, player, and even play-by-play data in a clean, easy-to-use format. When I did my last major project I was combing through the NHL play-by-play data up till 2017-18 and it was quite messy. Fortunately, Evolving-Hockey absolutely has the best quality of any of the major hockey stats sites I’ve looked at and it makes hobbyist work like this so much easier. For that reason, although I’ll use their data and make some of my data available, I won’t include anything from their site that can’t also be found on NHL.com or other free sites.