Do Analytics Darlings Scale Up the Lineup?
How do players who put up good numbers in limited minutes perform when given a bigger role?
The dust is settling on the first week of the 2025 NHL free agency season. Although free agency is usually associated with overpaying for veterans, there are typically a few so-called analytics darlings available for teams to snatch up in the hopes that an expanded role. That is, players who have put up strong advanced stats while being underutilized by their teams. With most potential free agents already re-signing with their current teams, or doing a sign-and-trade with Vegas, the pickings are slimmer than usual. This year, Nikolaj Ehlers and Nick Perbix both fit the profile of analytics darlings: player who are likely looked at as potential up-the-lineup players next season.
Does production scale up the lineup though? While plenty of analytics darlings have panned out with bigger minutes, many others have fallen flat with increased responsibility. Ehlers in particular has failed to gain the trust of multiple coaches who have consistently limited his minutes, despite elite underlying numbers. Are 2-3 more minutes a night really too much for him to handle?
Here I want to look into how production is affected by increased ice time for “analytics darlings.” I’m defining an analytics darling as a player in a depth role, third pair or lower for defensemen, third line or lower for forwards, who’s Expected Goal Above Replacement per 60 minutes is more in line with a top of the roster rate (top 4 for defensemen, top 6 for forwards). I’ve opted for xGAR instead of GAR because xGAR is intended as more of a measure of ability than just production, and NHL teams and coaches have shown an ability to identify talent separate from production (as we’ll see later). I’ll repeat the same exercise separately for forwards and defensemen, first looking at whether players are used efficiently, then looking at how production changes from year-to-year with an increased team role. All data is from Evolving-Hockey.
Forwards
To begin, let’s look at whether coaches are deploying their forwards efficiently. To do this, I ranked each forward according to their even strength xGAR/60 rate within their team and compared it to their even strength time on ice per game played, limiting this to players that played at least 30 games for the team that year. Rank was chosen instead of raw xGAR/60 and TOI/GP to avoid the results being skewed by differences in talent distribution across teams (e.g., someone has to play first line minutes on a tanking team).
The result was a positive correlation between EV xGAR/60 and EV TOI/GP of 0.41, or an R-squared value of about 0.16. That’s not especially high, but without trying to account for things like line-matching, score state, chemistry, or various other coaching considerations, that’s reasonably good. Within the top six things get a bit muddled, but for the most part, top six forwards play in the top six. In general coaches do know who their best forwards are and give those forwards the most ice time. Notably, the R-squared is slightly higher for xGAR than GAR, suggesting that coaches are not fooled by the effect of randomness of production.
Digression: although the correlation between team rank EV xGAR and team rank EV TOI produces a higher R-Squared than the raw values, the correlation between xGAR and TOI when scaled 0-1 by team is lower, suggesting that while coaches generally get the order of their players abilities correct, they don’t have as strong a grasp of each players’ relative ability.
Of course it’s not perfect and some depth players are, by appearances, underused. Looking at a player’s production and team role (based on TOI/GP rank) the next season, we see that there are plenty of top six caliber players who do not get moved up the lineup.
This is more evidence suggesting coaches do have some idea what they’re doing, though they can be slow to react. Essentially, on average, players who outperform their lineup spot regress the next season. Not only that, but player that regress more tend to not be promoted, while players who regress less (on average) are the ones who are promoted. However, there are still plenty of players who continue to perform at a top six, or even top line, level while toiling away in the bottom six the next season.
Now, it’s a bit difficult to disentangle cause and effect here. Is this a case of coaches having a good sense of which players are likely to regress more and therefore opting not to move them up the lineup, or are coaches waiting to see which players maintain their high level of play and only promoting those who are able to maintain it? It seems possible (likely even) that certain skillsets scale better than others and that coaches are able to identify players who would do well with a promotion. However, without more granular data about player skills and a game-by-game value added measure, it’s hard to say whether coaches are being proactive, reactive or both.1 Nevertheless, it is clear that there is a positive relationship between increased role and staving off negative regression.
Binning players by line may not be the best way to look at the effect of increased ice time, however. Not all first and second lines are deployed the same. If instead we limit our analysis to players who were saw their team TOI/GP rank increase from the bottom six to the top six from one season to the next and plot their minutes per game change against their EV xGAR/60, we might be able to determine the direct effect of increased ice time.
While the slope of the dotted red line is (slightly) positive, the entirety of the line is below the breakeven point, indicating that regression is more likely than continued improvement. Furthermore, the confidence interval is quite wide (you can draw a downward sloping with the shaded grey area as well), suggesting the relationship is too weak to state definitively that players improve or get worse with more ice time.
However, there are other mitigating factors. Could some role growth be associated with younger players being giving a chance to grow? Do larger players handle increased roles better? If we run a regression including variables to control for age and size we find that taller forwards perform slightly better than shorter forwards when moved up the lineup, but that time on ice is still not a significant factor.2 Overall very little of the change in a player’s ability is explained by the combination of usage and biographical detail (R-Squared of about 0.03).
Defensemen
What about defensemen? Do they handle promotion differently from forwards? Short answer, no, not really, but there are some slight differences that are still worth exploring in a bit more depth.
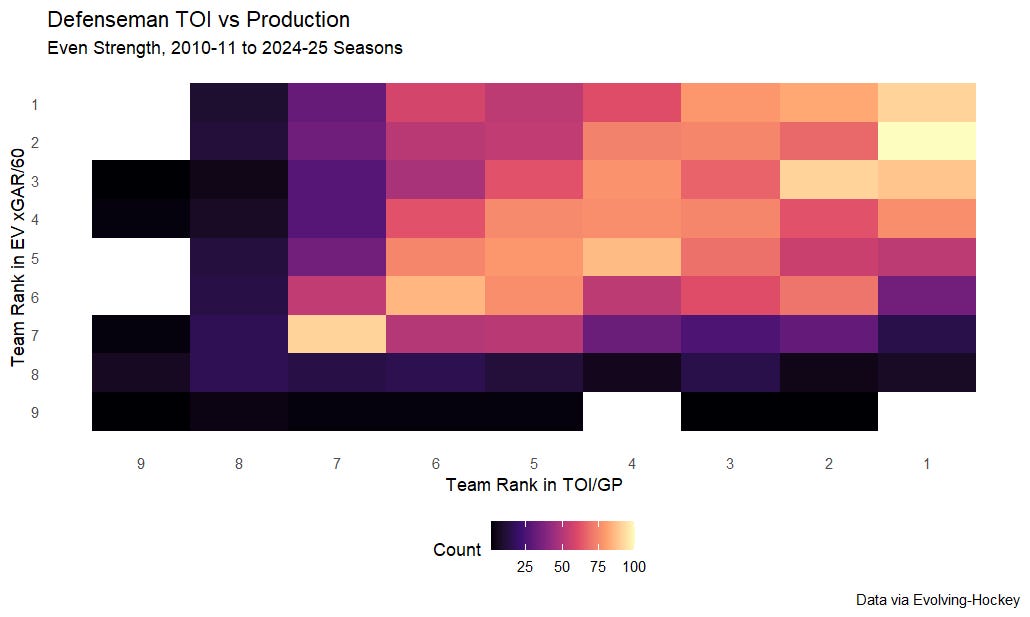
Repeating our first step from our analysis of forwards, we see immediately that teams are less efficient at distributing ice time to defensemen, with a positive correlation between TOI/GP and EV xGAR/60 of 0.26 and an R-squared of just 0.07. That’s much lower than the same results for forwards.
There are two likely reasons for this, to my mind, though they’re not mutually exclusive. It’s possible coaches are not as good at evaluating defensemen as they are at evaluating forwards and so distribute ice time inefficiently. Or perhaps xGAR is not a good model for evaluating defensemen and players rated as top or bottom pair caliber are actually much worse or better than xGAR suggests. Most likely it’s a mix of the two. They do generally do a good job of identifying their top seven defensemen, but the ordering within the top six leaves a lot to be desired.3
When it comes to defensemen coaches are certainly not infallible, as evidenced by Cody Ceci’s entire career, which I wrote about here.
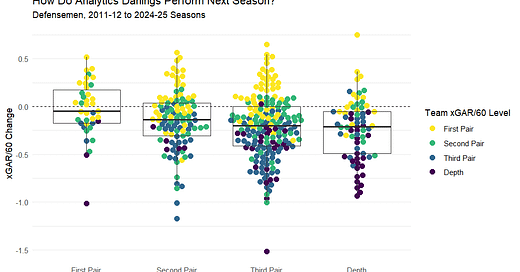
We also see a similar pattern as before with forwards suggesting that coaches, either proactively or reactively, give role promotions to players more likely to maintain their high level of play, though plenty of players that “deserve” a promotion don’t get one.
Interestingly, however, the drop-off between players who were third pairing defensemen the next season and players who were relegated to depth is roughly equal. For forwards there was a noticeable drop from fourth line usage to 13th/14th forward territory. Again, it is difficult to determine the thought process here without more granular data, but it does seem like coaches are a bit less efficient with their roster choices when it comes to defensemen than they are with forwards.
Finally, if we repeat our last exercise from the forwards section, we see that there is a again a positive correlation between increased ice time and change in EV xGAR rate and is statistically significant with a 90% confidence interval.
As before the cause and effect are not clear. It is possible it simply takes more sustained high-level play for a defenseman to earn their coach’s trust than for forwards. That’s certainly the usual narrative when it comes to defensemen. However, I wouldn’t rule out the possibility that logging more game minutes has a positive impact on development, muting the effects of regression to the mean.
In fact, age and time on ice change are positively correlated. When running a regression that controls for age and size, the significance of time on ice per game disappears, suggesting to me that age may be a causal factor in time on ice. Additionally, size was not a significant factor in explaining change in EV xGAR/60 for defensemen, whether height, weight, or BMI was used as the predictor.
If we reverse the regression and use the change in a player’s xGAR rate to explain the change in their TOI per game (controlling for age and size), the R-Squared is twice is high (0.04 versus 0.02). This further supports the theory that for defensemen coaches care more about size and experience than results or ability when giving out playing time.
Conclusion
NHL coaches are generally good at apportioning ice time across their rosters with the best players getting the most ice time, however, there are more inefficiencies when it comes to defensemen than forwards. This makes sense for a results-driven business where winning is usually necessary for a coach to keep their job.
For the players who perform well in a limited role, these “analytics darlings” often see regression the following season, although many still maintain a top six/top four level of play. Coaches typically show a moderate ability to identify players who are able to maintain the level of play that made them a darling in the first place, while those who regress or drop off more tend not to be promoted.
Within the cohort of analytics darlings who actually earned more ice time, increased ice time was associated with less negative regression for both forwards and defensemen. This did not change when controlling for age and size, though the cause and effect between xGAR/60 and TOI/GP are ambiguous, leaving room for varying interpretations. Still, given some of the demonstrated inefficiencies in NHL coaching, it seems likely to me that a few more minutes a game does not have a significantly negative effect on a player’s efficiency and coaches are being overly cautious when promoting depth players, putting the burden of proof on the player to show they belong.
Game Score may be a decent proxy, but to my knowledge the data is not readily available and recreating the current version including teammate and competition adjustments is outside the scope of this project.
I tried multiple variations of height, weight, and BMI and first, second, and third degree polynomial fits and found height was a better explanatory variable than weight or BMI.
This could be because of the traditional offensive/defensive defenseman pairing most coaches default to. Either coaches put players above/below their ability in the name of balancing skillsets, or models don’t do a good job of quantifying defensive value added, though I lean towards the former explanation.


This is great. Do you think there’s some selection bias though in that not all “analytical darlings” are given a larger role?
Such a great piece