There’s a phrase to describe goaltenders, which I’ll refrain from using myself (because it’s annoying), but essentially it sums up the idea that goalies are impossible to predict, which is true! Goaltending, more than any other position seems subject to cruel twists of fate beyond the control of the netminder. Any viewer can remember dozens of fluky goals the goalie seemingly did everything right on, or at least nothing wrong on, that still ended up in the back of the net. How often have teams left their goalies out to dry for a game, leaving him with little to no chance of making saves on chance after chance? Conversely, what about how often a goalie whiffs on a puck and is bailed out by their crossbar? In theory, this may cancel out over the long term, but when the margin of error between a good game and a bad one is often just one goal, and so many goals are not the goalie’s fault, how can you evaluate a goaltender, much less predict how they’ll play in the future with any degree of accuracy?
In this article, I present a new metric for evaluating goaltenders: expected saves (xS). Conceptually, this is similar to existing expected goals models (various xG models influenced aspects of xS), but taken from the goaltender’s perspective, rather than the shooter’s. I’ll expand on additional differences in later sections, but in my opinion, the biggest innovation is to treat struck posts the same as a goal, i.e., a shot attempt the goalie should have saved, but didn’t. This might seem like a small change, but it increased the predictive power of the metric substantially, although, as we will see, it is still quite low compared to metrics for skaters. Goaltenders are hard!
Previous Work
Goaltending evaluation seems fundamentally related to shot quality. A good goaltender will not just save more shots, they’ll save more dangerous shots as well. To that end, there have been many attempts at quantifying shot quality over the past several years in the form of various expected goals models. Listed below are the write-ups I consulted in developing my own model.
The table below summarizes each model’s methods and various attributes as I understand them.
Methodology
My final model borrows aspects of almost all the models I consulted in the development process. The only exception is Matt Barlowe’s model, though his article helped conceptualize how to build an expected goals model during the early rounds of development. After some testing, I landed on XGBoost as the algorithm I used. I trained four separate models for even strength, shorthanded time, power play time, and empty net defense (shorthanded and power play are from the goalie’s perspective, i.e., a power play save means the team shooting was shorthanded).
Data Collection and Preparation
I collected my training data from Evolving-Hockey using their play-by-play query tool. I ignored the 2007-08 and 2008-09 seasons and the current season. The main data-cleaning process consisted of filtering out shots that did not have the necessary information to be included in my model (number of skaters on the ice, missing teams, coordinates, etc) and correcting it manually where possible.
Preparation meant getting the data into the format I wanted to train the model. Some of the preparation steps I made were placing all the offensive zone shots on the right side of the rink, calculating arena adjustments, and converting categorical features to binary features using one-hot encoding. After cleaning and preparation, I was left with the following features:
Three angle variables: angle to the center of the net, horizontal available angle, and vertical available angle
Distance from the center of the net
Four-time elapsed variables: time since faceoff, turnover, zone change, and last shot, plus four flags for if any of these occurred within three seconds of the shot
Coordinates of the current shot and previous event
Two speed variables: distance changed since the last event divided by time elapsed and the angle changed since the last event divided by time elapsed
Three handedness variables: if the shooter is on their strong side, if the shooter is on the goalie’s glove side, and if the shooter’s stick matches the goalie’s glove
Flags for if the shot is below the goal line and outside the offensive zone plus if the previous event was below the goal line
Shot type: missing, “Cradle,” “Goalpost,” “Bat,” and “Poke” were all classified as “Other”
Skater strength state from the goalie’s team’s perspective
Lastly, I split my data into four separate datasets for each game strength I wanted to build a model for: even strength, shorthanded, power play, and empty net defense. Then I further split each set into equally sized training and test sets.
Arena Adjustment
My arena adjustment method deserves more detail because as far as I know, it is unique. TopDownHockey adjusts for arena bias by adding or subtracting distance from the net based on the average difference between a team’s road and away shots. My issue with this is that I don’t believe it’s methodologically sound to move a shot from right in front of the net out five feet, just because on average the team is. It doesn’t seem plausible to me that a shot so close to a landmark could systemically have an error that large.
What I attempted instead, was to match the distributions of a team’s home and away shot attempts along the x and y axes separately. That is, if a team’s home shot distance along the x-axis has an average of 33 feet from the end boards and away their average is 35 feet, I added 2 feet to all their home x-coordinates. Next, I multiplied the x-coordinates by the ratio of the home standard deviation and the away standard deviation to expand or contract the distribution. If an adjustment landed outside the blue line or the goal line, I only partially adjusted the coordinates to keep the coordinate between the blue line. Then I repeated the process for the y-coordinates.
My assumptions for this were two-fold, first that the arena scorekeeper was not biased in favor of the home team, rather that they were just bad at marking coordinates. This was mostly borne out by arenas showing similar distribution patterns for both the home and visiting teams, while the team’s home and road splits did not show the same patterns. Second, I assumed that given a landmark, such as the blue line or the goal line, the scorekeeper wouldn’t make an egregious error, except occasionally, so I could be comfortable assuming the shot was not outside the main offensive zone.
For the most part, these adjustments were fairly small. The biggest adjustment was the early 2010s New York Rangers, who were notorious for their arena bias.
Angles and 3-Dimensional Space
Hockey is played on a flat surface, but obviously, the puck is not bound to the ice. NHL play-by-play is limited to just two dimensions, however. I attempted to account for this by looking at the angle from the location of the shot to the crossbar. This has a linear relationship with shot distance, which I also included as a feature, but the algorithm did gain a decent amount of information from the available vertical angle, so I think it was worthwhile to include.
Similarly, I included a feature for the available horizontal angle. If the rink is a pizza, it’s how wide the slice of pizza is that contains the goal. Similar to vertical angle, this is derived from other features, but the algorithm identified vertical angle as containing the most information of any feature, as we’ll explore later.
Model Development
Initially, I aimed to build a better xG model primarily to evaluate goaltenders. Logistic regression seemed like a stronger candidate due to its ease of interpretation. Specifically, I had the idea of creating additional models for individual goaltenders and comparing the coefficients to a master model to see how an individual compared to an average goaltender on specific aspects of goaltending. At this stage, Matt Barlowe’s model was incredibly helpful, though I ultimately abandoned this approach. I discovered that at an individual level, there is far too much variance to make meaningful comparisons between what factors are more or less impactful for a goaltender on making a save than average. Furthermore, XGBoost was significantly outperforming logistic regression. That’s why I settled on using XGBoost as my primary algorithm; the same algorithm used by Evolving-Hockey, MoneyPuck, and TopDownHockey.
This was my first time using XGBoost in depth and there was a bit of a learning curve. Evolving-Hockey’s expected goals write-up was extremely helpful in figuring out how to use the algorithm and getting started on hyperparameter tuning. Ultimately I used an iterative approach tuning one hyperparameter at a time. The number of possible combinations was too high to test them exhaustively and a random search method did not help narrow down hyperparameter ranges either. Additionally, with over half a million shots in the training set and an underpowered computer, it could take hours or even days to finish one iteration of random search, depending on how many rounds I was testing. Altogether, I went through five rounds of model development testing different combinations of features and target variables and different tuning methods.
All models also embed the assumptions of the developer, so I think it is worth elaborating on four decisions I made in the development of the model and my thought process behind them: focusing on the likelihood of a save instead of a goal, excluding missed shots but including posts, separating models by game strength (even strength, shorthanded, power play, empty net defense), and excluding game context (score, clock, home/away).
Expected Saves Vs Expected Goals
As I’ve already mentioned, at the outset of this project, I wanted to build an expected goals model that was more predictive of goaltender performance than current models. Separately from this, I have wondered for a long time if including posts in addition to goals in goals saved above expected measures might improve predictability. Partway through this process it occurred to me that I could include goals and posts together implicitly by modeling the probably of a save (“SHOT” in the play-by-play). I think this also frames the metric more as a goaltender-centered metric. The goaltender’s job is to make saves, this, ideally, says how many saves he should make.
Excluding Missed Shots but Including Posts
As mentioned previously, I believe this is my biggest break/innovation compared to previous models. As far as excluding missed shots, there is evidence both for and against the idea that forcing misses is a goaltender skill. I couldn’t replicate the study suggesting it was a skill, although this may have been because I did not replicate the process correctly. Furthermore, I find the lack of correlation between miss percentage and save percentage or delta fenwick save percentage more compelling than the correlation between even and odd games, given that defense or systems may have a larger impact on misses. Therefore, I feel justified in excluding missed shots from goaltender evaluation.
When it comes to including posts, my idea is pretty simple. I don’t believe any goaltender can tell whether an incoming shot will hit a post and stay out. Plenty of goalies grab shots that are going well wide of the net and the margin for error of a puck hitting the post is so small that it strains credulity to claim that the goalie intentionally let it hit the post instead of reacting. Basically, in my opinion, a shot that hits the post is a shot the goalie should reasonably be expected to have reacted to.
Separating Models by Game Strength
While MoneyPuck and HockeyViz use just a single model for all strength states and include strength states as a variable, I felt that the differences between the game at various strength states were great enough to justify different models for each. For example, on a power play, teams are more static and use more cross-ice puck movement and one-timers. However, this shouldn’t increase the probability of a goal equally across the ice surface. Similarly, a much higher proportion of shorthanded shots are rush chances than at even strength, but this shouldn’t equally increase or decrease the chances of a goalie making a save or not from all locations.
Excluding Game Context
Several models, though not all, included contextual variables, such as game time, score state, goal differential, and whether the shooter is at home or away. I excluded these mainly because I struggle to justify a mechanism by which they would impact the probability of a save in a repeatable way. I suppose a leading team may be facing a weaker goaltender given that they’ve already allowed more goals, or that a discouraged team may not be trying as hard, but I’m not sure that tells us much about goaltender ability. When I did test a version of my final model that included contextual features, the repeatability decreased. In sum, context may improve the descriptive value of an expected saves model, but it seems to weaken its predictive power.
Evaluation
One of the challenges with this model is that it is rather different from existing models, so a one-to-one comparison does not make sense. For example, a typical expected goals model has a log loss value of around 0.2. Evolving-Hockey’s model has a very impressive 0.205 in all situations and 0.189 at even strength. (Sidenote: one effect of this project has been an even greater appreciation for Evolving-Hockey’s expected goals model, which really is fantastic). Mine model comes in at 0.301 in all situations and 0.282 at even strength. Including contextual variables improved each of those by about 0.001, which did not seem meaningful.
It’s hard to tell what this means in a vacuum, so let’s look at some calibration charts to see how the predicted probabilities match the actual conversion rates.
As we can see, the predicted save rate matches the actual pretty closely until the predicted probability is below 50%. The model slightly overestimates the likelihood of a save consistently, but I have a theory for why that might be, which I’ll explore later. At the extremely low end of the chart, the model appears very poorly calibrated. However, digging deeper into the results, I found only 3 shots in the lowest predicted bin and 9 in the second lowest. In samples that small, it should be expected that a few saves or goals/posts would swin the calibration pretty badly. If we look at calibration by game strength, a similar pattern emerges.
Again, the number of samples in the smallest probability bins is generally small; single or double digits. I found it interesting that power play saves (i.e., shorthanded shots) did not have a probability lower than about 50%.1 I don’t have a good explanation for this at the moment, however. Overall, I think I may be able to improve the model in subsequent versions, but I think the probabilities are reasonably well-calibrated.
So the model is descriptive, but how predictive is it? To test this, I looked at how well a goaltender’s saves per expected saves for n number of shots predicted their saves per expected saves for their next n number of shots. I tested this in increments of 10 up to 3,000 shots. Essentially, this predicted everything from how one typical period predicted the next period to how two seasons for a starter predicted the next two seasons for a starter. For comparison, I also included a version of my expected saves model that included contextual variables, regular save percentage, goals per Evolving-Hockey’s expected goals, and goals plus posts per Evolving-Hockey’s model.
Saves per expected saves is significantly better earlier and has a much higher peak than the other metrics. The predictive power maxes out at an R-squared of 0.112 for 2,150 shots. In other words, a goalie’s performance on 2,150 shots explains a little more than 11% of the variance in their performance on the next 2,150 shots. That’s not particularly good in absolute terms but is significantly better than the other metrics tested. I was surprised to see that the predictive power decreased once the sample got over 2,150 shots. I hope to look into this more in the future, but I wonder if this is being caused by long-career backup goalies taking several years longer to reach that threshold, giving more time for their ability to change.
Even strength follows a similar pattern, though with less predictive power.
Interestingly, all the even strength metrics peak much earlier than at even strength. Goals per expected goal is almost as non-predictive at 3,000 shots as at 10. Overall, I’m happy with these results as the first version of the model, but I hope to improve the model over the summer.
Analysis
Model
Now let’s look at what each model considers the most important predictors of whether a shot is saved. First up, even strength. Note that if a feature was mentioned previously, but is not listed below, this means the algorithm did not find it useful in predicting a save.
Even Strength
The most important variable for information gained, I was excited to see, is the available horizontal angle, followed by distance and time elapsed. This is, not surprisingly, similar to Evolving-Hockey’s expected goal model. Overall, this roughly lines up with what you’d guess is important based on watching hockey.
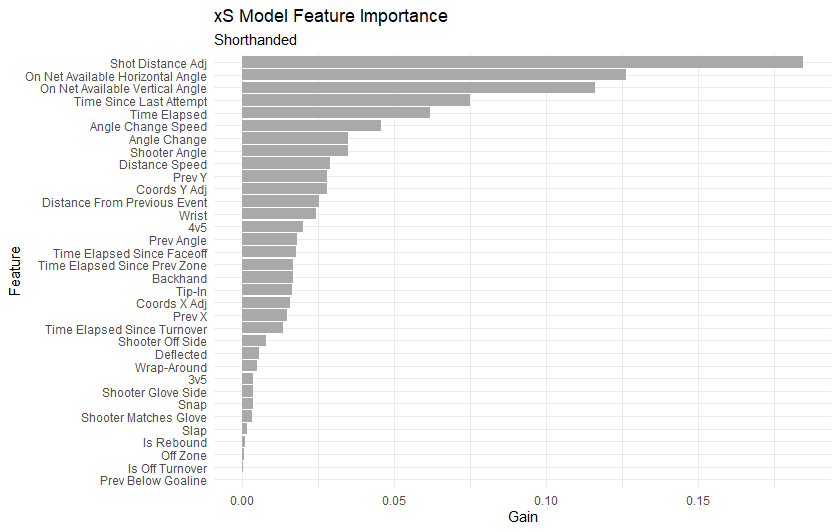
Shorthanded
Not much to note about the shorthanded except that this is the only model for which horizontal angle is not the most important feature. This is purely a guess, but I assume that’s because on the power play opposing teams can generate much more dangerous chances close to the net than at even strength. It’s also worth noting that the information gain is much more spread out among features than other models. Presumably, this is because so much of what makes a power play dangerous is puck movement forcing defencemen and goaltenders out of position, something play-by-play data doesn’t capture.
Power Play
Power play saves have the fewest number of predictive features. I assume this is also why they have the narrowest range of predicted probabilities.
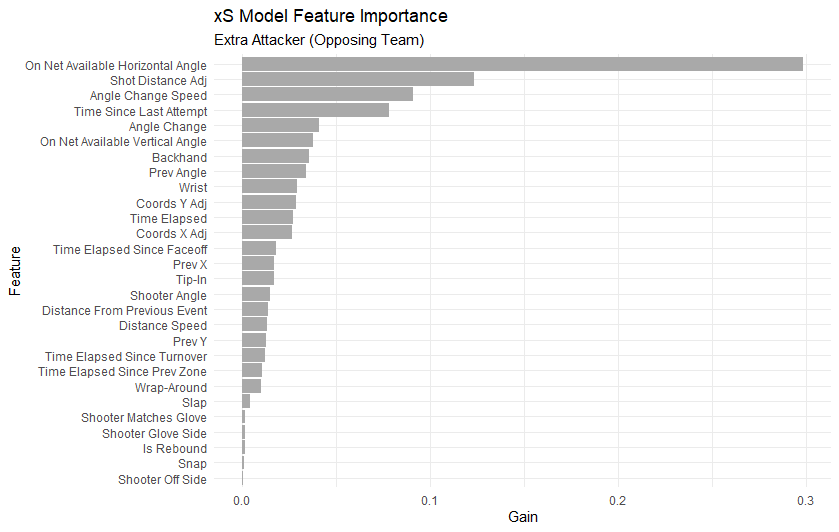
Extra Attacker (Opposing Team)
The extra attacker model looks most similar to the even strength model. I think there may be a case to be made for rolling this into the even strength model in a later version.
Results
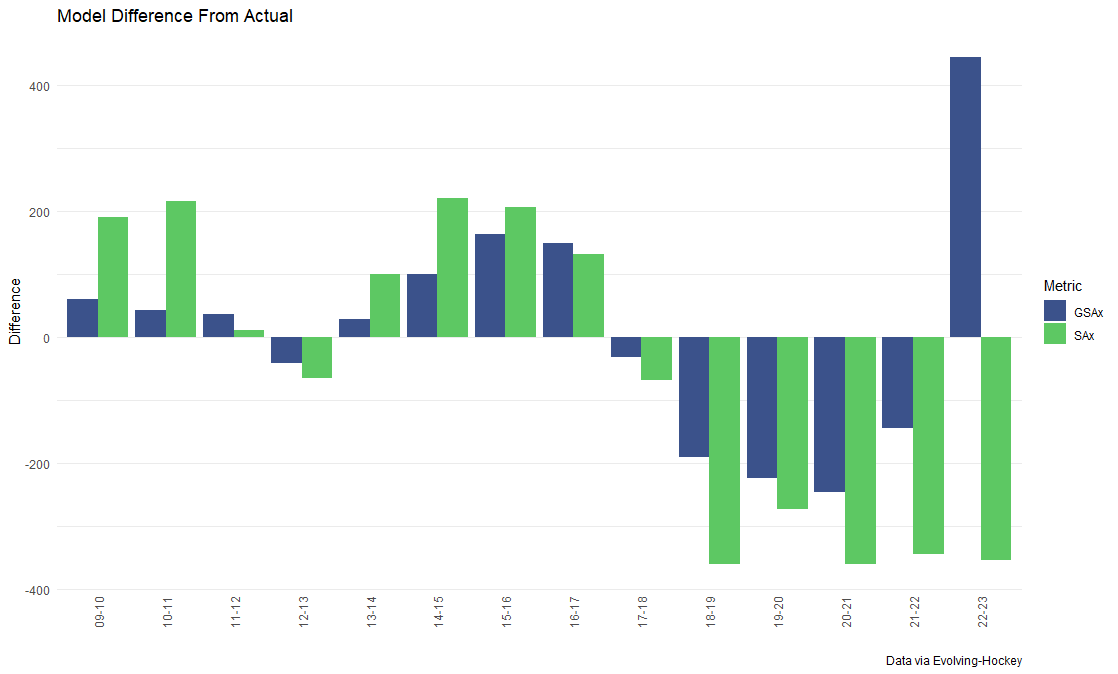
Finally, let’s take a look at the actual results. First, how does it compare to Evolving-Hockey’s expected goals each season as far as the difference from the actual number of goals/saves made?
Not wildly different, except for 2009-20 and especially 2022-23. In fact, I think the large negative difference from 2018-19 on is a feature, rather than a bug. That was the year the league introduced the new restrictions on goaltender chest protectors. A large consistent drop means the new rule worked! This also makes me wonder if it would be worthwhile to train a separate model for the 2018-2023 seasons to account for such a dramatic rule change, similar to TopDownHockey’s approach. I suspect this would also help with the earlier seasons having higher differences. This is also the reason alluded to above, that I think my model systematically overestimates the likelihood of a save.
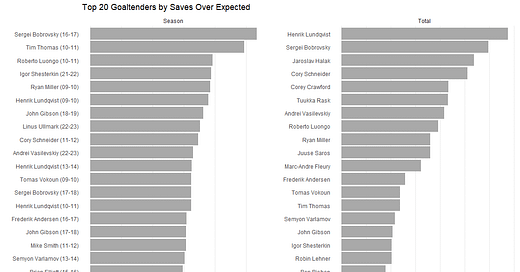
Next, let’s look at the top and bottom goalie seasons and careers by saves over expected.
I don’t think there are any massive surprises here. It’s really striking to see Tim Thomas and Roberto Luongo’s 2010-11 seasons both in the top 3. John Gibson was also so good early in his career.
On the other end, all I can say is poor Martin Jones. The Sharks rolled out the worst goaltending tandem in the modern era last season and possibly the worst ever.
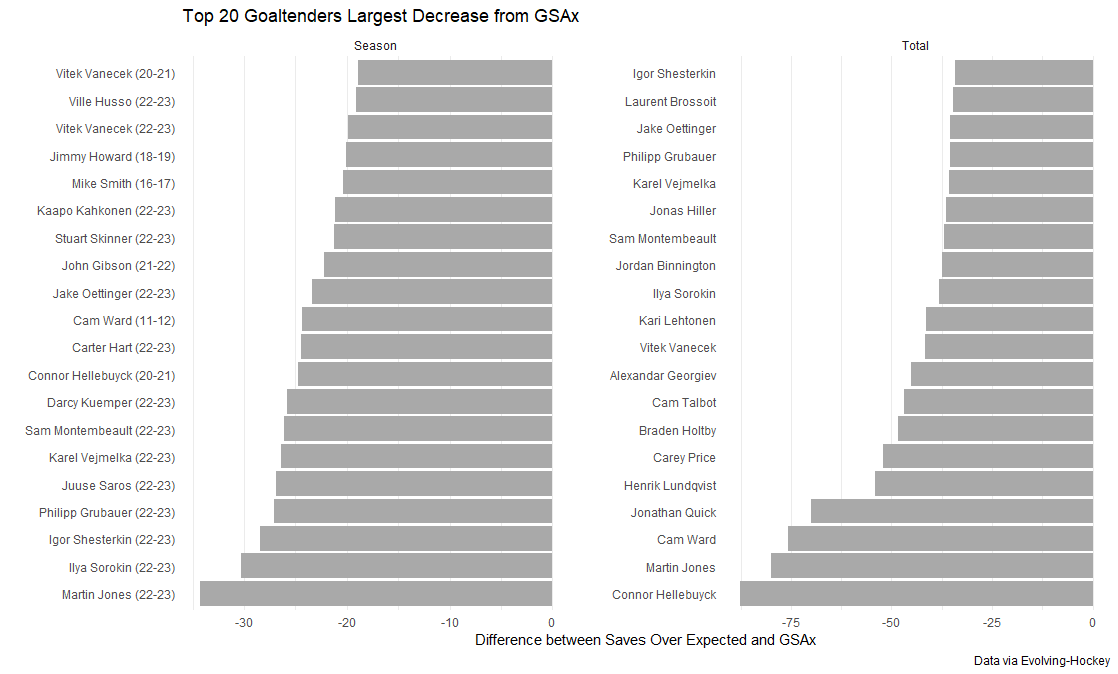
Lastly, I think it would be interesting to look at how my model differs from Evolving-Hockey’s goals saved above expected numbers. Below are the largest increases and decreases by season and career.
Sergei Bobrovsky improves massively by this metric. Late-career Martin Brodeur also gets a nice boost. Interestingly, although he has one of the worst career totals, Steve Mason also sees one of the largest career improvements by this model.
It’s not surprising to see so many seasons from 22-23 on this, given that was by far the largest single-season divergence between models. On the career side, it’s very surprising to see Hellebuyck with the largest downward adjustment. It’s not surprising for Henrik Lundqvist to show up here, given that coordinate adjustment was a major part of my process and Madison Square Garden was notorious for its inaccuracies. It’s worth pointing out that even despite the fifth-largest downward difference, he’s still the top goalie for a full career, and this model doesn’t start until 2009-10.
Seeing so many 22-23 goalies on the list, plus the aforementioned impact of the chest protector regulation, raises the question of whether an era adjustment might make sense for comparing goalies across seasons and careers. This is something I plan to return to later.
Conclusion
I don’t intend this to be the final version of this model, but rather just the start of an iterative process. Although goaltending by its nature is always going to be highly variable, especially in small samples, I believe public analysis can improve from where it is right now. I hope this is a step in that direction. Anyone interested in looking at the outputs for all goalies can follow this link to download a CSV file.
I know this is a bit confusing, but I don’t think it makes sense to call saves a goalie makes when they’re on the power play “shorthanded.”
