Introducing RAPM for Transition Statistics
Which players drive zone entries and exits with possession?

One of the things that makes hockey so difficult, and fun, to analyze is that there are so many different moving parts that contribute to the final result of a game. While goals obviously get the most attention, understanding the processes that lead to goals is arguably far more important to understanding the game that focusing on the mechanics of goal-scoring.
Transition play is one of those processes. Exiting the defensive zone kills opposing offense and is the first step of switching from defense to offense. Entering the offensive zone leads to offensive opportunities, while denying the offensive zone to the opponent prevents offensive opportunities. Strong transition play is the first step to getting results.
Recently this was highlighted in a piece Sean Shapiro wrote for D Magazine about what the Stars should expect from Mikko Rantanen going forward. While the piece on the whole was extremely complimentary of the superstar winger, one section caught my eye.
Rantanen thrived in Colorado playing on a line with Nathan MacKinnon. That led to a larger narrative, often perpetuated by people outside of Colorado prior to the Avalanche trading Rantanen to Carolina last year, then in Denver afterward, about how Rantanen was more of a points merchant because of his superstar center. But as one NHL scout put it, “MacKinnon set the tone for the first 180 feet of the ice, but once they were in the offensive zone, Rantanen drove that way more than people realize.
—What Can the Stars Expect From the First Full Year of Mikko Rantanen?
This struck me as a bit of a strange assertion. It implies that Rantanen was reliant on MacKinnon to get into the offensive zone where he could get to work.1 How valuable is an in-zone offensive dynamo if he can’t get into the offensive zone himself? If Rantanen needs someone to carry the puck into the zone for him, is he really worth his contract?2
Naturally, I decided to check the data to see if this was true. Corey Sznajder’s tracking data contains zone entries and exits and his player cards at AllThreeZones show how each individual player compares to the rest of the league in entry/exit rates. However, when it comes to outcomes metrics, most of the advanced stats community has moved beyond individual, or even simple on-ice or with or without you (WOWY) metrics, and now primarily uses regularized adjust plus/minus numbers (RAPM). These account for the impacts of teammates and competition by encoding each player on the ice as a predictive variable, and adjusts for score, venue, usage, and potentially many other factors.
So when I had the idea to look into who was driving offensive zone time, I decided to try my hand at creating regularized adjusted plus/minus metrics for transition play. After all, as with goals, expected goals, or corsi, individual rates are not the same as impact.
Methodology
To begin, I downloaded every individual game sheet available from AllThreeZones for the 2024-25 season. After a bit of data cleaning around team names, I combined entries and exits with play-by-play data obtained from the NHL’s API and HTML reports. From that, I filled in who the on-ice players were for each entry and exit.
Next, I had to define what I was looking for. I opted to focus on entries and exits with possession. For entries, I defined that as either a controlled entry (i.e., an entry in which the attacking team carries the puck across the offensive blue line) or a recovered dump-in. For exits, that meant only carried exits and successful passing exits counted. My hope is this avoids rewarding players for dumping the puck in or simply flipping the puck to the neutral zone and allowing the opposing team to recover and re-enter the zone.
After that, I grouped each set of events by the shift they occurred during and aggregated a total number of controlled entries and exits for each team. Each shift comprises a continuous period of play with the same set of players for both teams from either the last change or the last faceoff. For example, if Evgeni Malkin gets on for Sidney Crosby during play, that is the start of a new shift. If the Penguins are immediately whistled for an offside after the change and there’s a faceoff in the neutral zone, that also constitutes a new shift, even if no substitutions are made.
Next each shift was split into an offensive and defensive shift for each team. What this means if there were a single shift in which the Penguins gave up two controlled entries and made one controlled entry, that shift becomes and offensive shift in which the made one entry and a defensive shift in which they gave up two entries. For exits offense meant exiting the zone, while defense meant holding the offensive zone. Shift counts were then converted to a per 60 minute rate and variables were added for score, venue, and zone starts, relative to each team.3 Each player in the league is encoded as two columns, one for offense and one for defense, with either a 1 indicating they were on the ice on offense/defense for that shift or a 0 indicating they were not.
All of this is fairly standard for hockey RAPM. One unique feature of this analysis is that I included variables for balanced handedness for defensemen and forwards for each team. Handedness is something that I’ve written about before, but I think controlling for it is useful for separating a player’s ability from his environment. There is some evidence that defenseman handedness has an impact on both passing patterns on exits and denial rates. Controlling for that separates each player’s ability from their environment, including playing with or against a balanced defensive pair. I included forwards as well, though I did not expect that to make a significant difference. For forwards, balanced handedness mean two forwards had the same handedness.
After setting up the data, I ran two ridge regressions using R’s glmnet package; one for exits and one for entries weighted by shift length.4 I ran a cross-validated version of each with 10 folds to determine the lambda before running a final version. In total there were 245,888 shifts with transition offensive and defensive impacts calculated for 841 different players.
Results and Analysis
All the usual caveats about hockey statistics apply here: statistical tools like ridge regression can be fooled in small sample sizes, even across a full year, results are unstable from year to year, etc. This is not meant to be a definitive ranking of the best transition players, especially considering the relatively limited sample (a little under 30% of all games played for the season, which is an insane amount for one person to track manually). Caveats aside, here are the full results for the 2024-25 regular season for entry and exit RAPM, converted to z-scores by position.
Scanning the top of the table, the results generally pass the smell test, though there are some unexpected names near the top. Connor McDavid and Nathan MacKinnon lead forwards in entries by a mile, while Evan Bouchard and Quinn Hughes are near the top for defensemen. Jackson LaCombe, the subject of a fantastic in-depth breakdown by
rates extremely well by both entries and exits with possession.Using my game-by-game NHL EDGE data, we can compare a player’s transition RAPM to their even strength offensive zone time ratio (OZ time divided by OZ time + DZ time). Let’s start with exits.

There’s essentially no relationship between being net positive at exiting the defensive zone with possession and limiting opponents from exiting the defensive zone with possession and spending more time in the offensive zone. The R-squared is closer to 0.001 than 0.01, meaning exit RAPM explains closer to 0.1% of offensive zone time than 1% of offensive zone time. This is actually higher than either offensive or defensive zone time percentage individually.
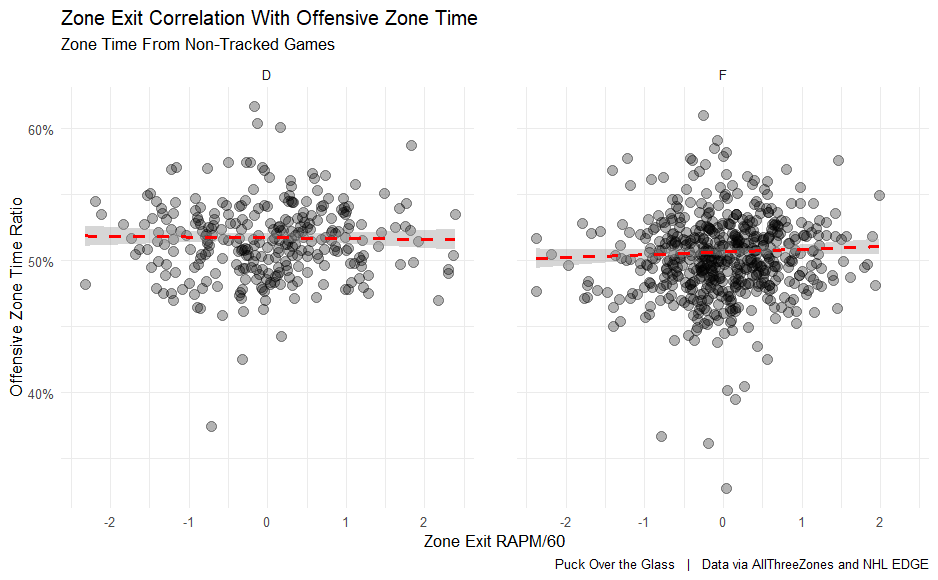
Bizarrely, the R-squared is slightly higher when looking at non-tracked games than tracked games, though still closer to 0.001 than 0.01. I would chalk this up to random variance rather than any increased explanatory or predictive power. Essentially, net zone exits with position have very little bearing on offensive and defensive zone time.
I have some concerns my approach to this is flawed. If a player never gains the offensive zone, it makes sense that their controlled exits against will be low (positive), while their offensive zone time is also low (negative). Or on the flip side, a team that gets hemmed in their own zone may have a large volume of offensive exits (positive) but also high defensive zone time (negative). My hope was that using only exits with possession mitigated this, as teams that get hemmed in their own zone tend to flip the puck out,5 but it’s not clear whether that has been borne out in reality. I would classify the exit data as inconclusive on its impact, though leaning towards non-consequential.
Entries are another story.

The R-squared for all players in 0.138, which increases to 0.197 with a cutoff of just 50 minutes played. That seems extremely high: an individual player’s entry RAPM explains almost 20% of their zone time after just 50 minutes of EV play (4-6 games for most players), though it doesn’t improve much beyond that. That’s an extremely quick time for metrics to stabilize. Where things really get exciting, however, is when we compare entry RAPM to the zonetime from games there were not tracked.

The correlation is weaker here: the R-squared is 0.079 for all players and 0.115 when limited to players with at least 50 minutes tracked. Essentially, after just 4-6 games, a single player’s own zone entry ability explains about 11% of their future zone time, regardless of teammates, competition, and deployment. This improves as the sample size increases up to at least 0.162 for a 250 minute played cutoff, though the number of players who qualify starts to decrease rapidly after that.
Not to toot my own horn, but that’s remarkable. I’m not sure I’ve ever come across another metric in hockey that predicted future performance with such a low threshold in terms of sample size. Zone entries with possession, are a huge, huge driver in the ratio of offensive zone time to defensive zone time.
What is particularly satisfying about this for me is the causal direction here. While corsi is an excellent proxy for offensive zone time, it’s fairly clear that offensive zone time (and individual effectiveness in the offensive zone) is what drives corsi and not the other way around; hence the somewhat specious assertion that players and teams will juice their corsi by taking bad shots. Transition play can’t be hacked though. To play in the offensive zone more, a team needs to get more controlled entries than they allow. This analysis shows just how much that matters.
Conclusion
Somewhat surprisingly, exits were almost uncorrelated to either offensive or defensive zone time or the ratio of the two. Entry with possession RAPM was extremely strongly correlated with spending more time in the offensive zone, however. Exits are not meaningless, but when it comes to winning games, entries with possession, successful offensive entries and denying opponents, appear far more important.
Of course, zone time is only part of the game, what a team does with that zone time is another question. After transition impact, it seems natural to question individual impact within each offensive or defensive zone. In my next article, I’ll look into in-zone offensive and defensive impact separated from transition play.
Am I over-reading this? Probably.
Rantanen actually rated very well at transition play last season, though not near MacKinnon’s level.
Score state was limited to +/-3 goals.
I also ran a version that combined exits with possession with entries with possession as a “zone advancement” plus/minus, but the results were not significantly different from focusing on entries and exits individually.
Source? Something to look into, maybe.
Very interesting…what good is someone who needs someone else to enter the zone? I love it.
Love the convo, love the analysis. Thanks!
Any idea on why the NHL pbp doesn't include entries, exits, breakouts, etc.?