NHL EDGE: Quantifying Even Strength Playing Styles Using Zone Time
A look at in-zone play versus possession and transition play
When the NHL released it’s new EDGE data, the highlight for many, including myself, was the speed metrics. While skating speed and shot speed are the most exciting on the surface (those are some of the most fun to watch in hockey, after all), zone time offers a chip-backed measure of possession, a topic that gained salience during the analytics era. Although it’s been put to rest since then, there were accusations that players or teams could game their corsi numbers by taking bad shots, making corsi an unreliable measure of possession.
Not surprisingly, it turns out corsi share is a fantastic proxy for possession. The correlation between corsi share and zone time share was rough 0.87 for the 2021-22 and 2022-23 seasons. Furthermore, the rise of expected goals has largely eliminated the objections that teams simply take bad shots to make their possession numbers look good. Zone time appears largely redundant as a measure of team performance.
However, zone time still has some use as a measure of team process. If stats like corsi or expected goal rates are macro stats for measuring team performance and stats zone entries or denials are micro stats to understand how teams achieve their results, zone time sits somewhere in between. While not as granular as Corey Sznajder’s AllThreeZones project, zone time does give us a bigger picture view of how well teams are able to attack and defend the blue lines and a view of how effective teams are at attacking and defending with the offensive or defensive zone.
To that end I thought it would be worthwhile to look at how teams play on offense and defense. We can do this by comparing their zone time percentage with their in-zone expected goals for or against rates to see which teams are good territorially and which are good tactically.1
Before looking at the results, there are a few caveats I’d like to go over about the data. First zone time is measured by each player’s position, not the puck’s position, so it’s not a perfect measure of where the puck is or who has the puck. Second, the NHL presents even strength zone time numbers, not 5-on-5, so these numbers include 4-on-4 and 3-on-3 play. Those are a small enough share of EV play that it shouldn’t make a huge difference in the overall numbers, but it’s worth keeping in mind. Finally, to make comparisons a little more apples-to-apples, I used non-score and venue adjusted xG rates since zone time is also not adjusted for score and venue. Let’s get started!
Statistics are as of March 9. Shot data is from Evolving-Hockey. Zone time data is from NHL EDGE.
Offense
Keeping with convention other hockey charts, I divided the following chart into four quadrants: Opportunistic teams that struggle to get into the offensive zone, but are effective once they do, Grind It Out teams that gain the zone, but don’t generate chances at a high rate once they’re there, Dominant teams that are good at both gaining the zone and creating offense once they’re in, and Oh No teams that can’t get the puck up ice and can’t do anything with it when they do.
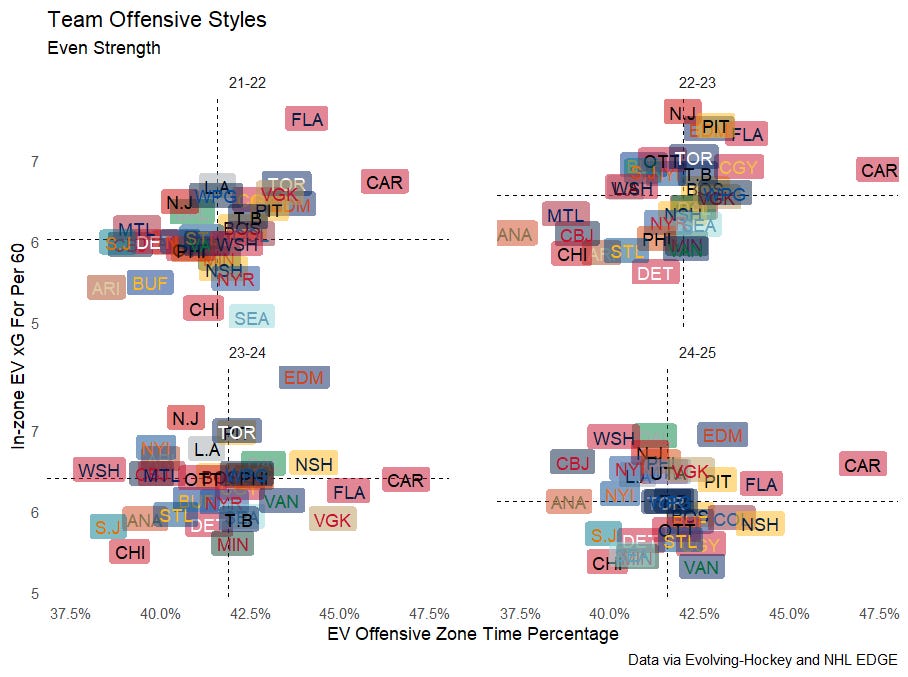
Carolina stands out here as a team that spends far more time in the offensive zone than anyone else and is also in the top half of the league at turning that zone time into offense. Dallas and Washington also stand out as elite in-zone offensive teams that are in the bottom half of the league in terms of zone time, indicating to me that they rely on rush offense to create chances. Teams like Chicago, Seattle, and, surprisingly, Minnesota really struggle to create anything.
Conveniently, these four quadrants divide the 32 teams in the league fairly evenly. At the time of writing, nine teams fell into each of the “Opportunistic” and “Grind It Out” categories and nine teams fell into each of the “Dominance” and “Oh No” categories. This is because the correlation between the two axes is almost zero (0.068), meaning there’s no meaningful relationship between zone time and in-zone offense this season. How does that compare to previous seasons?
Interestingly, for the 2021-22 and 2022-23 seasons, there is a strong correlation between offensive zone time and in-zone (0.511 and 0.467 respectively with p-values (much) less 0.05), but the 2023-24 and 2024-25 seasons see the relationship almost disappear (0.17 and 0.068 respectively with p-values (much) greater than 0.05).
My best guess for the cause is it’s related to the incorporation of the chip tracking data in shot locations, though it could also be either an offensive or defensive tactical adjustment or both.
Across all four seasons so far, the correlation is 0.295 with a p-value of 0.0007, indicating a statistically significant relationship. I’m looking forward to more seasons of data to determine if the 2021-23 seasons are really this much of outlier.
Defense
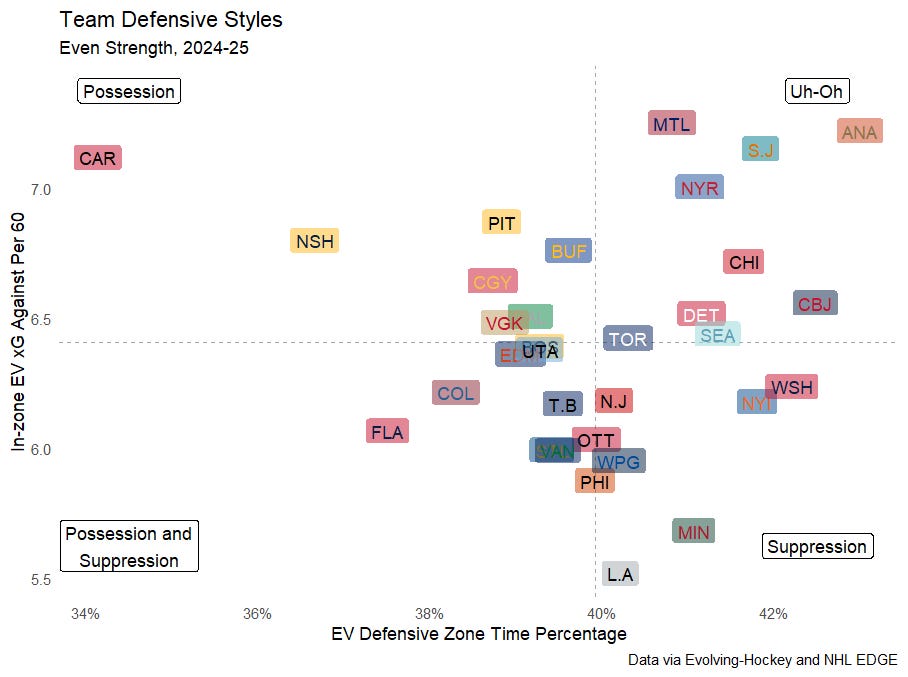
Following the same method as on offense, I divided defensive styles into four quadrants: Possession teams that defend through keeping the puck out of their defensive zone, but give up chances when they can’t keep the puck out, Suppression teams that limit chances against when they are in the defensive zone, but spend more time playing defense, Possession and Suppression teams that excel at both keeping the puck away from their net and limiting chances when they need to, and Uh-Oh teams that get stuck in their own zone and can’t stop the opposing team from getting chances.
Carolina really stands out from the rest of the pack here, to an even greater degree than they do offensively. Surprisingly to me, they’re quite leaky when forced to play defense, giving up the fourth highest xG against when in the defensive zone. At the somewhat opposite end of the spectrum Los Angeles and Minnesota excel in the defensive zone, but give up the zone a little more than the median team. Florida also stands out as being the only team firmly in the good at both quadrant on both offense and defense. Nashville stands out for the opposite reason, as a team that is great at tilting the ice in their favor, but is extremely impotent at both aspects of in-zone play.
As with offense, the teams are divided pretty evenly between the four quadrants. Nine teams each fall into the “Possession and Suppression” and “Uh-Oh” categories and seven teams fall into each of the “Suppression” and “Possession” quadrants. The correlation between zone time and in-zone offense is even weaker for defense at just -0.013 with a p-value of 0.945(!) indicating there’s virtually no relationship between zone time and in-zone defense. That hasn’t been the case historically, however.
Every prior season had a stronger correlation, with 2022-23 in particular standing out for its strong positive correlation.
This is much less of a clear divide between the chip seasons and the non-chip seasons. Overall across all four seasons combined, the correlation is just 0.087 with a p-value of 0.329 (not significant). Why defense would see less of a correlation than offense is a mystery to me.
It is worth noting that Carolina being such a huge outlier is clearly skewing things these results. With Carolina removed, the four year correlation is 0.207 with a statistically significant p-value of 0.021.
Putting It Together
We can combine offense and defense into a single chart by looking at each team’s ratio of zone time versus its ratio of in-zone offense to defense.2 In my mind, zone time share can be thought of as a measure of possession and/or transition play. The diagonal line below represents the break even point. That is, teams above the line are able to offset their deficiencies in possession and/or transition with their in-zone play or vice versa, while teams below the diagonal are not.
Not surprisingly, the top teams are Carolina, who get there with a ridiculous amount of offensive zone time relative to defensive zone time, Florida, who excel and both aspects, and Edmonton who mainly get their through offense, but are strong at all even strength aspects of the game. Philadelphia sticks out like a sore thumb as a team that looks elite at 5-on-5 play, but has been sunk by the worst goaltending in the league.
On the other side of the breakeven line, it’s not a surprise to see Anaheim, San Jose, and Chicago as the bottom teams in the league. Detroit has done an impressive job of rallying to get to the playoff bubble, but their even strength play is still nowhere near good enough to be a serious threat. Minnesota is also notable for having very poor even strength numbers for a playoff team.
As with separated offensive and defensive metrics, combined possession/transition play and in-zone play are largely uncorrelated this season (0.055 with a p-value of 0.763), but exhibit a stronger relationship across the full four seasons zone time is available. As before, there is a clear divide between the 2021-22 and 2022-23 seasons and the 2023-24 and 2024-25 seasons, which leads me to believe this is related to the change in how shot locations are recorded.
Notably, this is just a window into a single aspect of a teams’ play, albeit an important one. Goaltending, finishing, and special teams also affect a teams’ outcomes and are not captured here.
Conclusion
Even strength play is a crucial part of evaluating the strength of a hockey team. This dimension can be broken down into in-zone offense, in-zone defense, and possession/transition play. Each of these dimensions are fairly independent of each other over the past two seasons, suggesting these are separate skills that teams can work on individually. Further work can be done to determine which aspects of team play are most predictive of future performance and how different aspects match up against each other.
In-zone rates are each team’s xG for/against rate divided by it’s offensive or defensive zone time percentage.
Zone time share is (OZ%) / (OZ% + DZ%). In-zone xG ratio is (in-zone xGF/60) / (in-zone xGF/60 + in-zone xGA/60).


This is sick. I really like the team styles over time graph especially with how many coach changes occur in the NHL. And Carolinas is crazy to see math wise being so consistent basically
So many ideas spawn for that, really cool. Like it'd be cool to do this from a head coach perspective if the team they take over goes to the same style and which coaches have actually changed over time. Probably not useful but interesting data lol
Fantastic work as always.