In the course of researching the impact of skating speed, I went down several avenues which, while interesting to me, didn’t produce results substantial enough to carry their own articles. Nor were they relevant enough to the main topic of previous articles to be included in those pieces. However, I think these topics are still worth presenting. So this article is a bit of a mishmash of three things I looked at that are mostly unrelated to each other, though there is some overlap: bursts rates, aging, and rest. Since this is more exploratory in nature, this is a chart heavy article. Let’s get into it!
Burst Rates
One of the most frustrating things about the NHL EDGE data as it’s currently presented is, with the exception of skating distance/speed, none of it is game-by-game. As noted in part 1 of this series though, average speed is correlated well to burst rates. Particularly of the 18+ MPH threshold.
With this in mind, I suspected it was possible to create fairly accurate regressions to predict burst rates using average speed, player usage (ice time), score state, and ability (max speed). For my target variable, I used a player’s burst rate over the entire season. I separated regressions by position, limiting my sample to players who had played at least 20 games. Furthermore, I removed any games with an average skating speed of less than 6 MPH under the assumption these represented games with at least one period of data issues.
18+ MPH Bursts
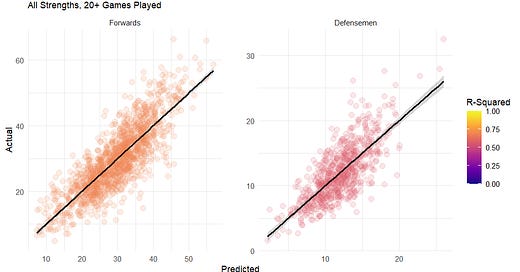
The results of the regressions for 18+ MPH bursts were fantastic. The R-Squared of the forwards regression was just under 0.7 and just under 0.6 for defensemen.
The regressions differed slightly between forwards and defensemen. For forwards, I used average even strength ice time and average power play ice time as proxies for usage, while for defensemen I used average penalty kill time. The regressions also differed in which average speed predictors they used, with the forwards regression using all situations average speed, while the defensemen regression used average even strength and average penalty kill skating speed. Finally, the defensemen regression also used a variable for average score difference over the course of the entire season.
Looking at the residuals plot, linear regression seems like an excellent fit for this analysis, especially for forwards.
The residuals for forwards show almost no pattern, though there is a slight splay for higher predicted burst rate. For defensemen this pattern is more pronounced. Still, this is an extremely good result for real-world data, and particularly for anything in hockey.
20+ MPH Bursts
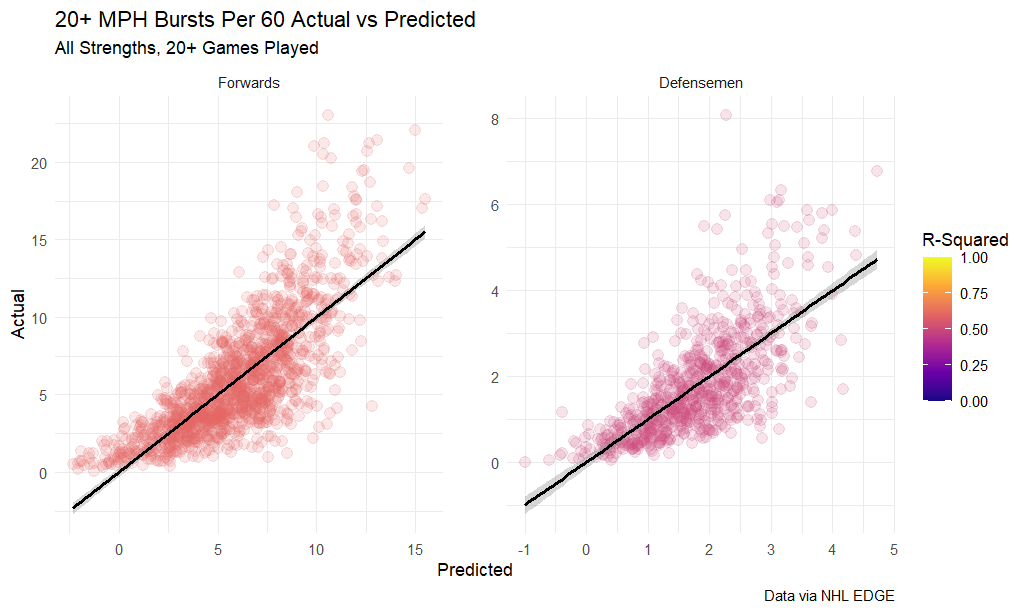
The regressions for 20+ MPH were less well suited to the data. Being able to exceed 18 MPH seems like a bare minimum speed requirement for all NHL players; no one with at least 20 games played did not reach that threshold. 20 MPH is harder to reach however, particularly for defensemen, which led to a skewed distribution.
These regressions were somewhat simpler, with forwards and defensemen using the same set of predictors: all strengths average ice time, all strengths average speed, and maximum speed. The R-squared values are still not bad, roughly 0.55 for forwards and just below 0.5 for defensemen, however we can see clearly that there is an swoop to the scatter plots for both positions.
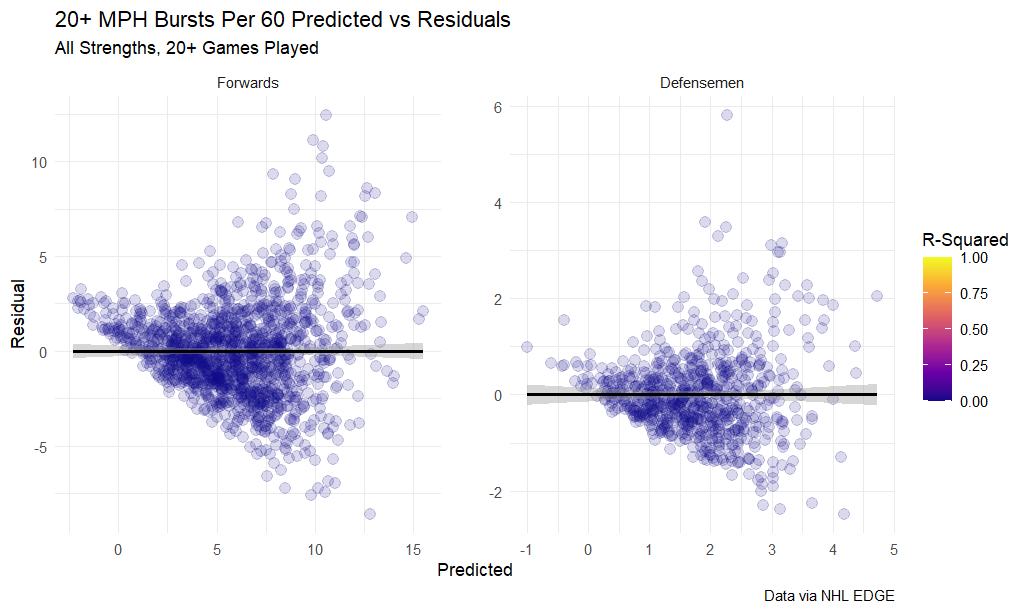
Moreover, looking at the residuals plots for each regression, the unfitness of linear regression for this data is apparent.
The residuals plots show two clear patterns, first a somewhat linear bizarre slope on the bottom half that’s caused by players predicted to have with very few 20+ MPH bursts. Second, the same rightward splay exhibited by the 18+ MPH residuals, only even more pronounced here.
While 18+ MPH bursts have a clear linear relationship with usage, average speed, and max speed, 20+ MPH bursts are clearly impacted by something else. I suspect scoring opportunities play a role, but I haven’t thought of a good way to account for that at the season level.
Aging
Age was another topic that seemed potentially fruitful, especially when looking at fatigue in part 2. Being limited to just three full seasons of data made it difficult to draw firm conclusions about the effect of aging, however. Similar to burst rates, I used 20 games played as a cutoff to ensure. This is an admittedly arbitrary cutoff, but because I don’t have any way knowing how long it takes max speed to stabilize, I opted for consistency in my cutoffs.
Additionally, I excluded Joe Thornton and Zdeno Chara from the aging analysis because they were so much older than any other players, I didn’t think it was methodologically sound to extrapolate trends for the ages between them and the rest of the population.
Max Skating Speed
Maximum skating speed seems like a strong candidate for age-related decline
There is a very clear downward curve for maximum skating speed. However, I don’t think that it’s clearly caused by aging. The NHL seems to my eyes to shifted to a faster league over the past decade or so, with teams placing more emphasis on speed now than they did 10-15 years ago. That means we should expected younger players to be faster just by virtue of when they were drafted.
If we look at how a player’s max speed changes year-to-year, the downward curve all but disappears. For this, I limited the sample to players who had played 20 games or more in consecutive seasons.
A few things stand out here. First, there is a lot of variance in max skating speed from year-to-year, with swings of +/- 1 MPH or more existing for essentially every age across both positions. Some of this may be due to random data collection errors, but it seems to swing in both directions, so I feel comfortable with looking at the aggregate trend. More importantly though, there does not seem to be a meaningful trend in any direction, with the very oldest and youngest players exerting disproportionate influence on the trendline due to how few of them there are. From 22 to 37, the trend is basically flat.
More seasons data may help this issue, but that’s something we’ll have to wait on.
18+ MPH Bursts
Looking at burst rate can potentially solve the problem from max speed of a single erroneous reading skewing the distribution, so let’s look at aging in that context next.
Again, there’s a very clear downward trend. However, once again, I’m not confident this reflects a real effect of aging versus other factors. We already know, for instance, that usage impacts burst rates, and younger players tend to be placed on lower/energy lines. Fortunately, we have a models that account for those factors from previously in this very article! Let’s look at how skaters perform relative to expectations by age.
This shows something! For both positions, there does seem to be a clear downward trend, particularly from around 24 to 30 or 31. However, I suspect we may be seeing the same change in how team’s value skating speed with that being a more selected trait among younger players, so let’s look at year-to-year change.
Here we see that once again, the trend disappears when only looking at year-to-year change. Again, there are some wide variations year-to-year, especially among forwards. However, the average change year-to-year continues to hover around zero.
One note about my methodology here is I may not be accounting for survivorship bias appropriately. That is, if a player is not good enough to stay in the NHL after a season, they aren’t included here. It’s possible that a large drop-off in skating ability signals a player will not play again the next season, but from a cursory look at the data, I did not find strong evidence of this. Perhaps as we get more seasons of data this trend will become more apparent.
Game-to-Game Rest
Lastly, when looking at fatigue, I was interested in the effect of how many days of rest a player had before.
For this analysis, I limited skaters to games with at least five minutes played at even strength and removed games with speeds below 6 MPH, on the assumption those games had data collection issues. I also limited this to 5 or fewer days between games, because 1) more than that it was likely that either the team had a long break or the player was injured/scratched in the interim and 2) the recovery benefits of rest after that many days almost certainly dissipate.
Surprisingly, the range of outcomes is similar across every rest interval, from back-to-backs to nearly a week between games. Perhaps this shouldn’t be surprising for professional athletes, but given that rest has a noticeable impact on shot metrics, I expected there to be some sign in physical ability as well.
And to tie things in to what I’ve looked at previously, here’s how each player’s average skating speed changes in back-to-back situations by age.
Once again, I’m surprised at how little variation there is across all ages. The simplest explanation is that playing in the NHL requires you to have great conditioning.
Conclusions
This concludes my look into skating speed for now. I plan to return to this as some point during the season, however. During the Stanley Cup Final, I hit upon the idea of re-scraping NHL EDGE data after each game to track changes in the stats that are only available at the season level to get game-by-game data, which I plan to write-up before the next season starts. While that limited me to a sample of just seven games, I hope to implement the same process for the regular season to build out a larger data set and hopefully provide more insights about what bursts, shot speed, and zone time can tell us.


That continuously scraping season level stuff to get game by game stuff idea seems really cool. Easy for me to say, not having to put in the work every day to continually regather the data, but I'd love to see you implement that.
It does seem to go against conventional wisdom that aging does not seem to reduce speed of skaters, not even burst speed, but I am willing to accept your explanation that players who have aged into being significantly slower perhaps just don't play anymore, voluntarily or involuntarily.
Also, coming from the social science world, where any R-square over 20 percent will create extreme suspicion of foul play, and almost certainly an investigation as to how your model can fit real world data so well, it's crazy that you can predict burst speed with an R square above 50. I guess it goes to show that top speed and burst speed are indeed very highly correlated.