Nothing Else Matters! History Will Be Made! Because It’s the Cup! If You Ain’t First, You’re Last!
The regular season is all fun and good, but they playoffs are what players, teams, and fans care the most about. We’re also constantly told that teams need to be built differently to win in the playoffs. Specifically size and experience are supposedly prerequisites for winning. Furthermore, this year’s Final featured two of the heaviest/densest (highest BMI) teams in the league, weighted by ice time. Surely there’s something there or this idea wouldn’t be so sticky. Well, let’s investigate!
Methodology
My methodology for looking at the playoffs was substantially different enough from how I had looked at the regular season that I feel it is worthwhile to describe it again. In my regular season analysis I looked at end of season team results that had already been aggregated at Evolving Hockey. Then I calculated the mean age and size of each team weighted by ice time and directly looked at the correlation between the on-ice results and the biographical details.
While it would be possible to recreate that for the playoffs, the format of the playoffs presents a problem. In the regular season, each team plays every other team and only goes head-to-head up to six times, depending on the season. That means that the competition each team faces will be roughly equal to league average, at least in theory. However, in the playoffs, each team plays a maximum of just four other teams, and half of the teams in the playoffs play just one other team. What this means is that the competition each team faces is not going to necessarily be close to league average. It’s possible for two big or two small teams to match up, which will skew the overall results. For this reason, I thought it was necessary to look at the difference between the biographical factors between the two teams, but that is not really possible using the playoff aggregated data.
To get around this problem, I decided to look at game-by-game results. I calculated the average age, height, weight, and BMI for each team based on the ice time in that game, as well as the goal, Corsi, and expected goal rates for each team. Then I compared the difference in the size between each position group with the difference in on-ice results. I used unadjusted rates, since I was unsure if the adjustment coefficients listed on Evolving Hockey would translate to the playoffs and I considered verifying that to be outside the scope of this post. (I would guess they do, but hockey men have said the playoffs are a different game). I also considered performing the adjustment method myself using just the playoff data, but again decided against it. For one thing, validating the value of making adjustments to be outside the scope of what I want to look at right now, and for another, there are only 1,263 playoff games in the sample, which is less than a current full NHL season. If I were using my own adjustment, I would definitely want to validate it before using it.
All Situations
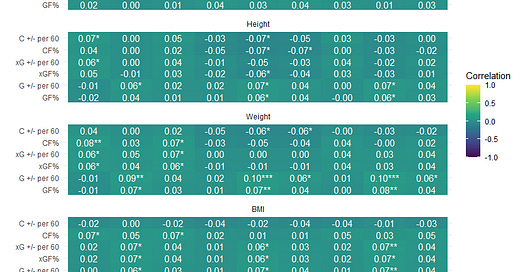
I’m going to use heatmaps similar to what I used in part 3 to visualize the strength of the relationship between the biographical comparisons. I compared the difference in each team’s weighted biographical averages with the difference in their rates and shares for Corsi, expected goals, and actual goals. I only looked at things from the perspective of the home team, since the differences between the biographical details and the rates would just be the negative value of the home value if I also looked at the away team and and the share would just be the complement, which seemed like double counting.
That’s a lot of teal, meaning not much in the way of correlation. There are a few instances where the correlation is statistically significant, but given how many pairings we’re looking at, we should expect that (There are 216 pairs, so we should expect about 11 pairs that are significant at p < 0.05). There are definitely more than that, and playing against lighter defensemen in particular seems to have a moderate correlation with goals for rates and differentials, though not on expected goal or very Corsi. This seems to suggest there is some truth to the idea that being light is a detriment on defense.
Even Strength
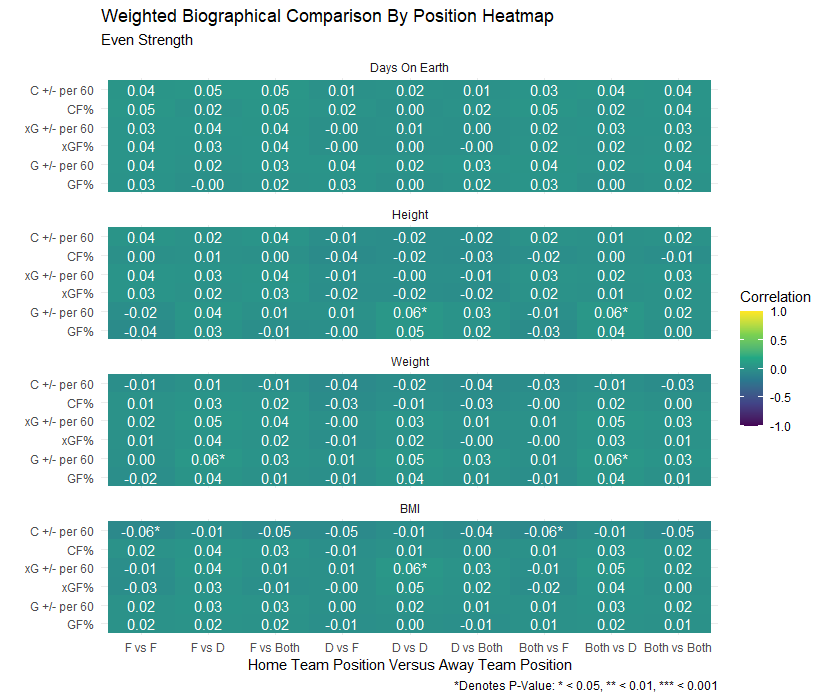
At even strength though, the correlations basically disappear.
Following the same methodology, we see far fewer correlations with a p-value less than 0.05 and new less than 0.01. There isn’t much to analyze here; I think it’s pretty safe to say that size and age don’t make a difference at even strength. Whatever was driving the all situations results is happening on special teams.
Power Play/Penalty Kill
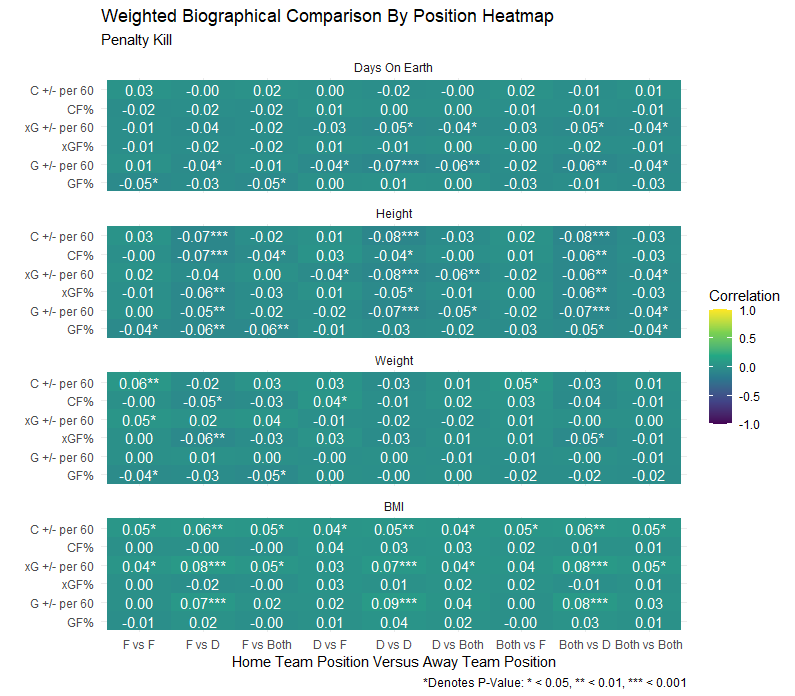
I’m going to look at this from the penalty kill perspective since as I’ve previously noted that seems to be where coaches value size the most, especially for defensemen. The power play heatmap would look exactly the same, just with the correlations multiplied by negative one.
Finally there’s something to dig into!
One thing to note here, at all situations and even strength, I treated each game as a single observation because the two teams would be inverses of each other, meaning there would. On the penalty kill though, one team’s penalty killing unit is not matched up directly against the other team’s, so each game has two observations. This means that the threshold for determining significance is lower, which is partly why there are so many more statistically significant correlations at the PK level than at even strength or in all situations. Now, let’s look at what stands out.
First, weight and age don’t seem to have much of a bearing on the effectiveness of a penalty kill, with the exception of older defensemen being negatively correlated with actual goal differentials. This is a very interesting contrast with the regular season results I examined earlier. I have a few ideas about why that might be the case. The first, in the regular season I used aggregated data, while in the playoffs I used game-by-game data. The difference in sample size may account for more variation in the results (notice the correlation thresholds for the p-values are higher in part 3). I think it’s also possible, and maybe more likely that there is some selection bias in playoff teams. Teams with big, bad (in the hockey skills sense) players on the PK are probably less likely to make the playoffs anyway. Still, the difference is enough that I want to redo the regular season post using a method like I’ve used for this post.
Height, on the other hand, has a noteworthy negative correlation with penalty kill outcomes. This seems to be in line with what I looked at in part 3, where height had a negative correlation with penalty kill effectiveness in the regular season. Height among defensemen especially seems to lead to a weaker penalty kill. Another way to look at it, could be that short defensemen on the power play are positively correlated with power play performance.
BMI, however, has a positive relationship with on-ice results. At first, this seemed contradictory to me, but I don’t think it actually is. In the regular season, BMI had a less negative correlation with PK outcomes than height or weight, so there already is evidence that it is not as much a drag on the PK as other metrics. Finally, it’s notable that this positive correlation is specific to being larger than the power play’s defensemen. Similarly to height, this could also be considered a commentary on the size of the power play defense with less dense defensemen having trouble on the power play in the playoffs. I would be interested in looking more at what drives the power play and penalty kill in the playoffs in a supplemental post to this one.
Conclusion
The most important takeaway from all this, in my opinion, is that even in the cases with the strongest correlations between a specific size difference and on-ice outcome, the correlation is still very slight, roughly +/-0.1. That means the R^2 value is roughly 0.01. Put another way, size only explains 1% of the variance . I don’t think there’s enough here to state definitely that size doesn’t matter in the playoffs, but between the lack of correlation at even strength and the mixed results on the penalty kill, I do think there’s enough here to state that size matters very little in the playoffs. Counter to conventional wisdom, it seems to matter even less than in the regular season. Although I don’t feel comfortable stating that there is no value to size, I do feel comfortable stating that like leadership, or intangibles, size should be considered a bonus rather than a target for GMs looking to improve their rosters for the postseason.
Fin.
A huge thank you goes to Evolving-Hockey for providing team, player, and even play-by-play data in a clean, easy-to-use format. When I did my last major project I was combing through the NHL play-by-play data up till 2017-18 and it was quite messy. Fortunately, Evolving-Hockey absolutely has the best quality of any of the major hockey stats sites I’ve looked at and it makes hobbyist work like this so much easier. For that reason, although I’ll use their data and make some of my data available, I won’t include anything from their site that can’t also be found on NHL.com or other free sites.


